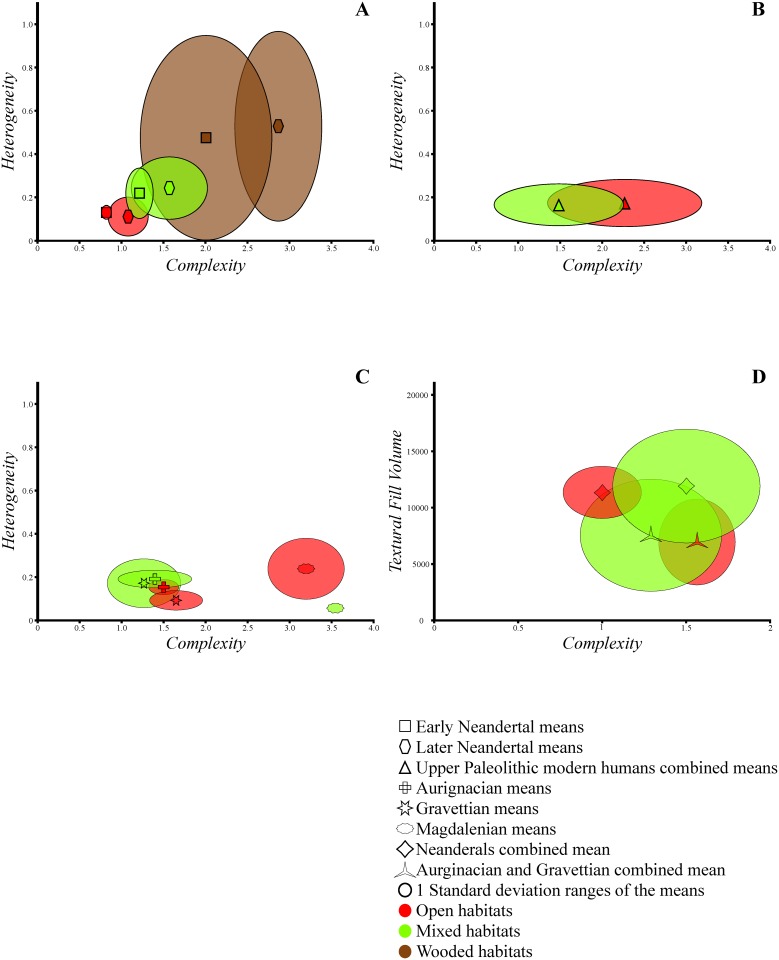
Fig 1. Bivariate plots of microtexture variables’ means and 1 standard deviations of Paleolithic groups.
(A) Bivariate plot of complexity and heterogeneity for the early and later Neandertal specimens each grouped by paleoecological category. (B) Bivariate plot of complexity and heterogeneity for the Upper Paleolithic specimens grouped by paleoecological category. (C) Bivariate plot of complexity and heterogeneity for the Upper Paleolithic specimens grouped by both paleoecological and technological categories. (D) Bivariate plot of complexity and textural fill volume for the Neandertals (both early and later) and earlier (Aurignacian and Gravettian) modern human specimens grouped by paleoecological category.

