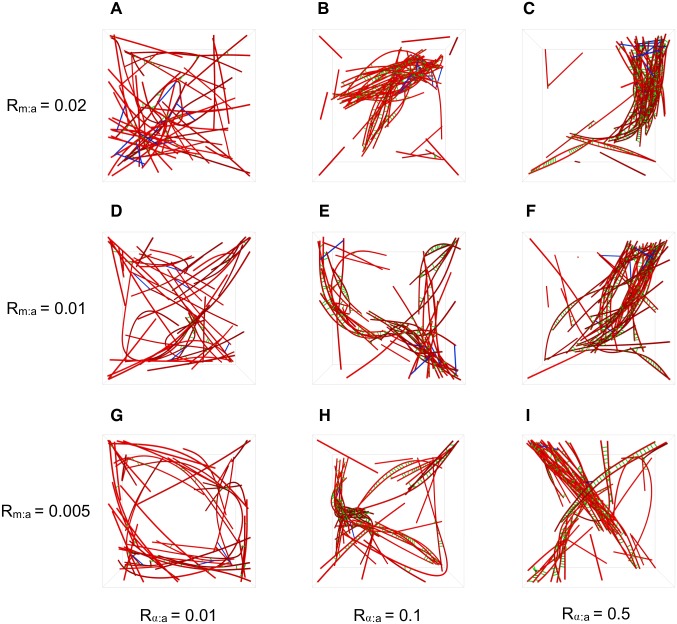
Fig 7. Single trajectory snapshots of the actomyosin systems with various concentrations of Rα:a and Rm:a after 2000 s of network evolution.
These snapshots are shown without diffusing species for simplicity. For increasing α-actinin and NMIIA concentration, actin filament bundle formation is increasingly more apparent.

