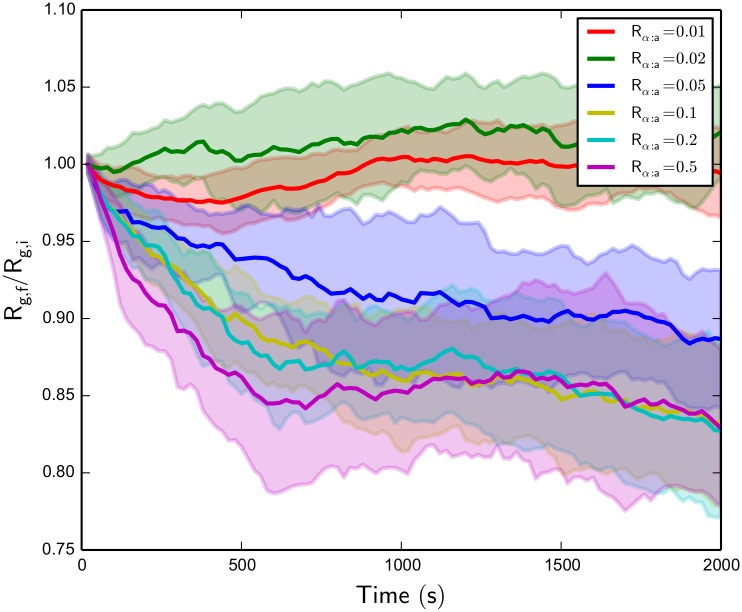
Fig 8. Actomyosin network Rg,f/Rg,i over time for various Rα:a with fixed Rm:a = 0.01.
We see that above a threshold α-actinin concentration, contraction is observed, and the time of bundle formation for these contractile structure formations decreases with increasing α-actinin concentration. Standard deviations of the R g,f/R g,i values over all trajectories are shaded.

