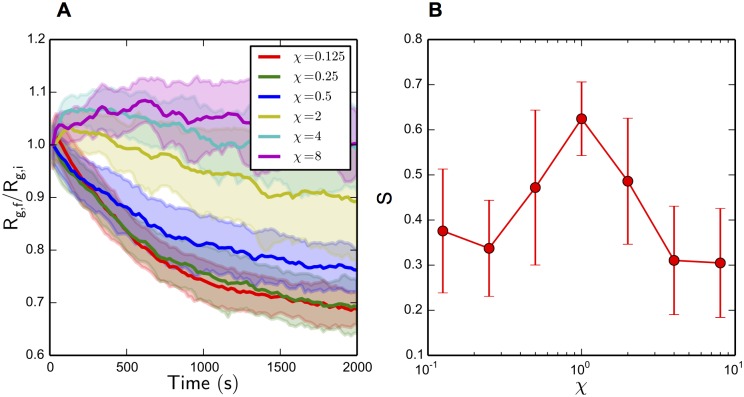
Fig 10. Actomyosin network Rg,f / Rg,i and S for various χ.
(A) R g,f/R g,i over the 2000 s network evolution for varying values of χ. Contractile behavior increases with decreasing χ. Standard deviations of the R g,f/R g,i values over all trajectories are shaded. (B) S after 2000 s of network evolution for varying values of χ. Global alignment peaks around χ = 0.5 to 2, and decreases for values outside of this range. Error bars represent standard deviation of S values over all trajectories.

