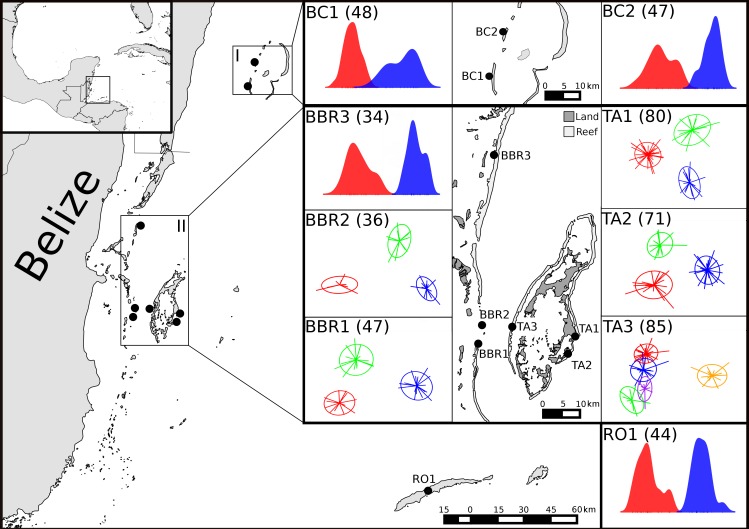
Fig 1. The Mesoamerican Barrier Reef study sites: BC–Banco Chinchorro, Mexico; BBR–Belizean barrier reef, Belize; TA–Turneffe Atoll, Belize; RO–Roatán, Honduras.
Insets show scatter plots (and density plots in the case of two clusters) of clusters from DAPC analysis within sampling locations. The axes of the plots are the first two discriminant functions used to delineate clusters with inertia ellipses representing 67% of the variance. The end of the lines connected to the centre of each inertia ellipse represent individuals plotted on each discriminant function and denotes cluster membership. In locations with only two clusters present there is only one discriminant function, as such density plots of proportion of individuals present at each value of the discriminant function were included to show cluster separation. Numbers in parentheses indicate how many individuals were collected from each location.

