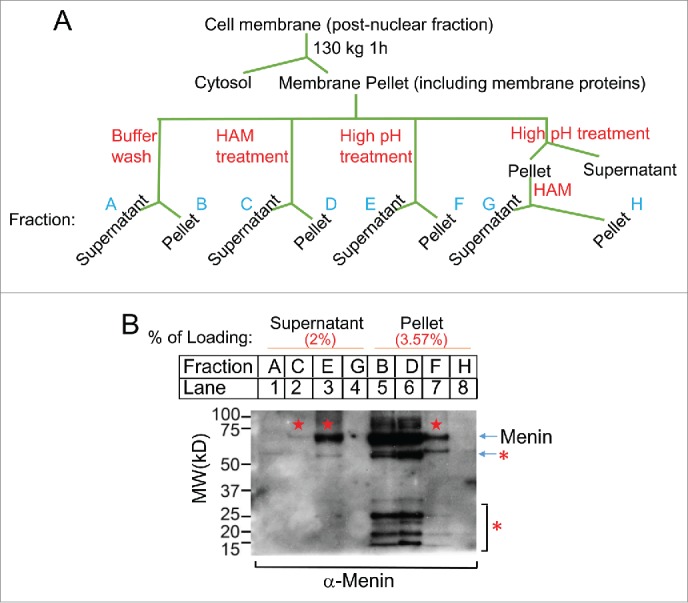
Figure 4.

Biochemical detetion of the Menin localization. (A). A diagram for experimental procedures of biochemical cell fractionation. (B). Immunoblot analysis of Menin extracted from post-muclear fraction as shown in Figure. 4A. Pentagram denotes menin. The bands highlighted with a star were potential degraded menin or crossactive proteins.
