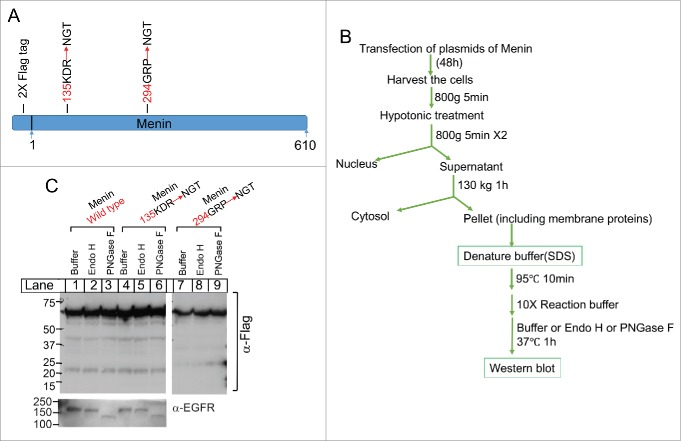
Figure 6.
Analysis of potential glycosylation of Menin. (A). A schematic diagram of the introduction of glycosylation sites on the surface of the menin protein. These sites were the loop regions on the surface base on the crystal structure of Menin. (B). A diagram for experimental procedures of cell fractionation and the treatment of the membrane fraction with various glycosidases. C. Immunoblot analysis of the potential size change of Menin after the treatment of glycosidases. EGFR was used as a positive control for glycosylase activity (bottom).

