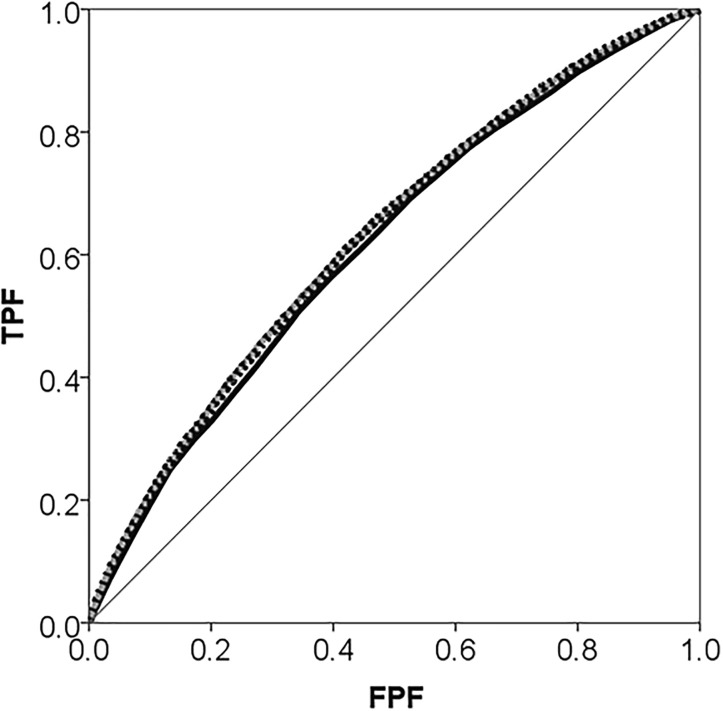
Fig 1. Areas under the receiver operating characteristic (AUC) curve for use of psychotropic drugs during 2006 in the city of Malmö, Sweden plotted separately for Model 1 which only adjusts for individual-level covariates age, sex and income (black thick line), and Model 2 which additionally adjust for neighbourhood of residence (grey dotted line).
The diagonal line represents an AUC equal to 0.50.

