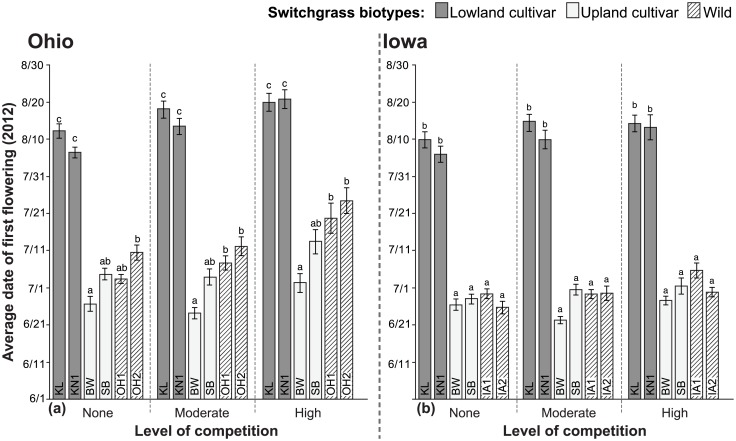
Fig 2. Onset of flowering in cultivated and wild switchgrass biotypes grown under three levels of competition at two locations.
Date of first flowering (mean ±1 SE) was measured in Ohio (a) and in Iowa (b). Competition treatments included ‘No competition’, ‘Moderate competition’ from little bluestem, or ‘High competition’ from smooth brome. Biotypes grouped within a level of competition that share common letters are not significantly different (P<0.05) based on Tukey’s HSD mean comparison tests; N = 11–15. ANOVA effects are summarized in Table 2; significant differences in means among competition treatments for each biotype, based on Tukey’s HSD tests, are shown in S1 Table.

