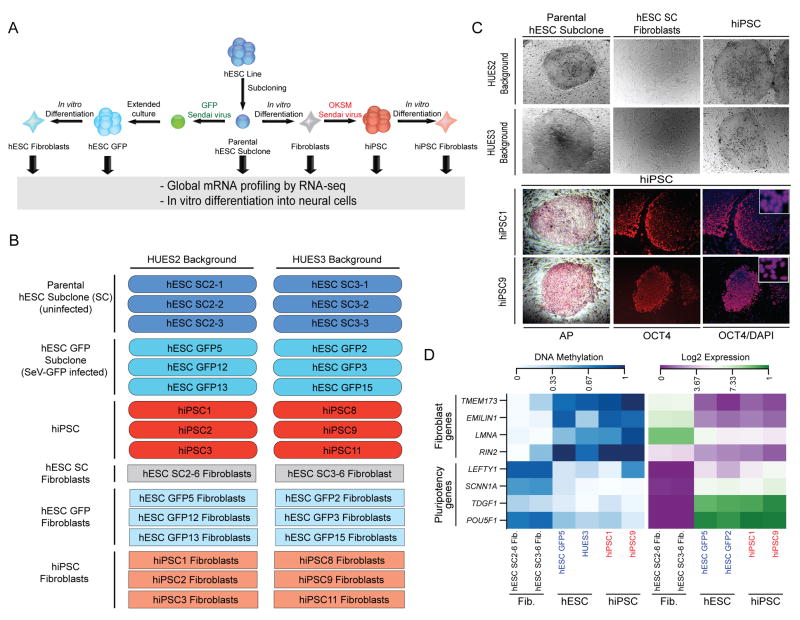
Figure 1. Generation of genetically matched hESCs and hiPSCs.
(A) Schematic for the generation of genetically matched hESC and hiPSC lines. (B) Overview of HUES2 and HUES3 derivatives used for RNA-sequencing. (C) Top panel shows bright images of hESC subclones, in vitro-differentiated fibroblasts, whereas the bottom panel shows hiPSC lines stained for alkaline phosphatase activity or OCT4 expression. Co-staining with DAPI confirmed nuclear expression of OCT4 (inset). (D) Heatmaps depicting DNA methylation (left) and gene expression (right) levels of key fibroblast-associated and pluripotency-associated genes in isogenic hESCs, in vitro-differentiated fibroblasts and derivative hiPSCs.

