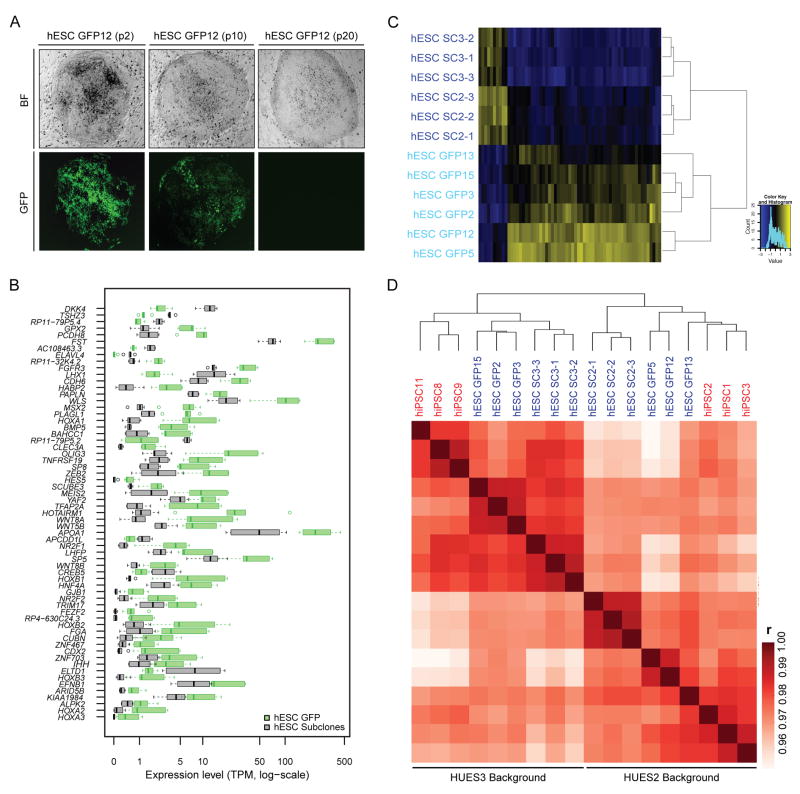
Figure 2. Influence of viral infection and genetic background on transcriptional patterns in isogenic hESCs and hiPSCs.
(A) Representative bright field (top) and fluorescence (bottom) images of the hESC GFP12 line at passage 2, 10, and 20 after SeV-GFP infection. (B) Expression levels of 63 genes that were identified to be significantly different between 3 biological replicates of hESC GFP and 3 biological replicates of hESC SC lines within each of the two genetic backgrounds (FDR<0.01 and fold change >2 or <0.5; see details in the Methods section). Green and grey boxes indicate the expression ranges for each differentially regulated gene in 6 hESC GFP and 6 hESC SC lines, respectively. TPM; transcripts per million. (C) Heatmap and dendrogram separating all isogenic hESC lines based on the 63 DEGs shown from Fig. 2B. hESC SC lines, dark blue; hESC GFP lines, light blue. (D) Heatmap and dendrogram for all isogenic hESC and hiPSC lines based on pairwise Pearson correlation (r) of global gene expression levels (log-scaled). hiPSC lines, red; hESC lines, blue.

