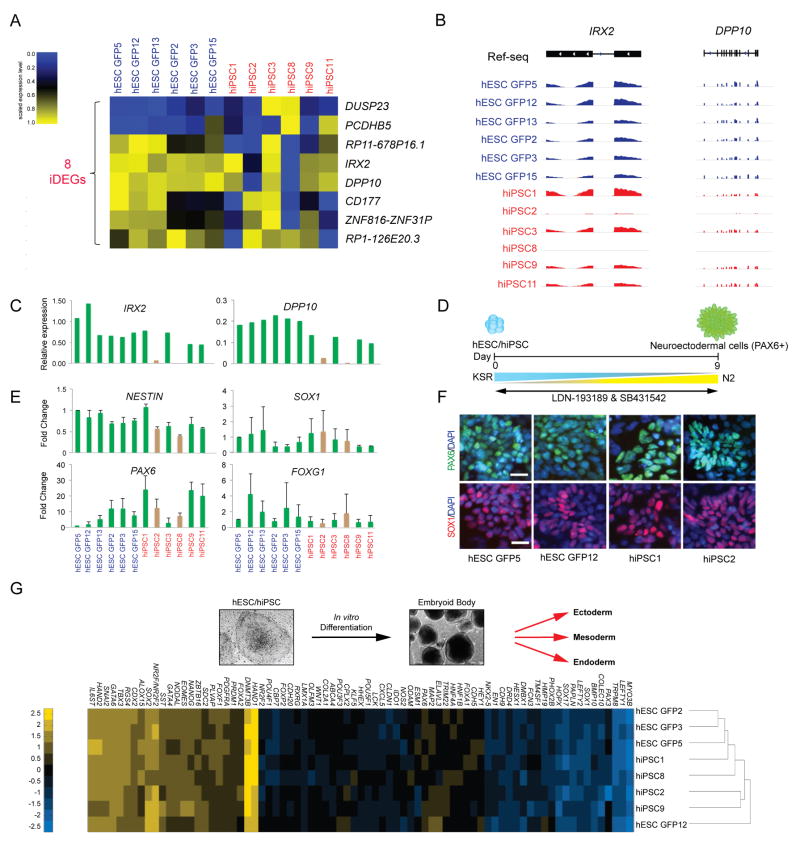
Figure 4. Dysregulation of genes in a subset of hiPSC lines.
(A) Heatmap of the 8 inconsistently differentially expressed genes (iDEGs) for all isogenic hESCs and hiPSC lines (as defined in Supplementary Fig. 3C) within each of the two genetic backgrounds at FDR<0.01 and fold change <2 or <0.5. hiPSC lines, red; hESC lines, blue. (B) Genome browser images of IRX2 and DPP10 RNA-seq reads in hESC GFP and hiPSC lines. (C) Expression levels of IRX2 and DPP10 by qPCR in each hESC GFP and hiPSC line, normalized to ACTB. Brown bars indicate hiPSC lines that have undergone aberrant silencing of IRX2 and DPP10. (D) Schematic for neural induction using the combination of SB431542, an ALK inhibitor, and LDN-193189, a BMP inhibitor. (E) Fold change of the neural markers NESTIN, SOX1, PAX6, and FOXG1 by qPCR in hESC GFP and hiPSC lines relative to the hESC GFP5 line. Brown bars indicate the hiPSC lines that have undergone transcriptional silencing of IRX2 and DPP10. Results are shown from three independent experiments. Mean ± s.d. (F) Immunofluorescence staining of PAX6 (green) and SOX1 (red) indicates neural differentiation at day 6 in hESC GFP and hiPSC lines. DAPI (blue). (G) Scorecard assay of embryoid bodies (EBs) derived from isogenic hESC and hiPSC lines. Heatmap and dendrogram for these EBs based on the expression levels of the indicated developmental genes.

