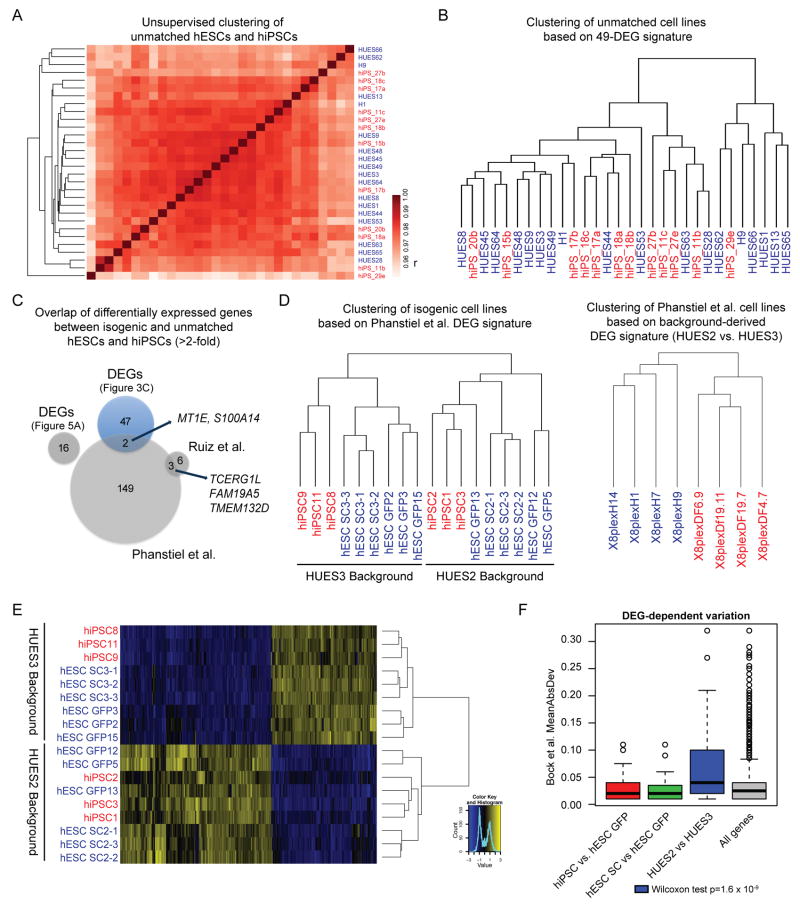
Figure 5. Analysis of previously reported gene expression differences and role of genetic background.
(A) Dendrogram and heatmap for unmatched hESC (blue) and hiPSC (red) lines based on pairwise Pearson correlation (r) on global gene expression levels (log- scaled). (B) Dendrogram based on the 49 DEGs identified using isogenic lines in Fig. 3C for all unmatched hESC (blue) and hiPSC (red) lines. Note the lack of clustering. (D) Venn diagram of differentially expressed genes between hESCs and hiPSCs identified in this study and previous reports utilizing unmatched hESCs and hiPSCs. Overlapping genes between DEGs from independent reprogramming studies are indicated by arrows. (D) Dendrogram of isogenic hESC and hiPSC lines using the differentially expressed genes identified by Phanstiel et al.10 (left panel) and dendrogram of hESC and hiPSC lines from Phanstiel et al. using HUES2 vs. HUES3-specific DEGs as discussed in the main text (right). hiPSC lines, red; hESC lines, blue. (E) Dendrogram and heatmap of isogenic hESC (blue) and hiPSC (red) lines based on HUES2 vs. HUES3-specific DEGs. (F) Transcriptional variation of different gene sets across unmatched hESC and hiPSC lines reported by Bock et al. Boxplots show mean absolute deviation (MAD) among hiPSCs and hESCs when considering indicated DEG sets. Note that HUES2 vs HUES3-specific DEGs show the greatest variation. A one-tailed Wilcoxon ranksum test was performed between each set of DEGs and all genes.

