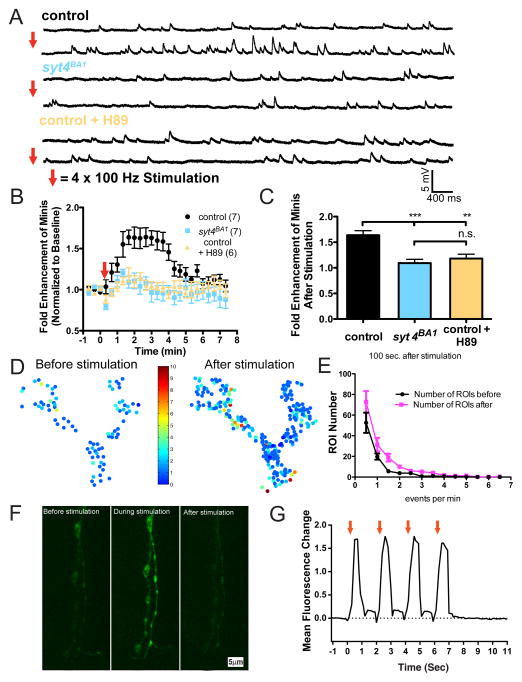
Figure 3.
Activity-dependent enhancement of minis requires Syt 4 and PKA activity. (A) Representative traces of minis before (top trace) and after (bottom trace) tetanic stimulation recorded from control (w1118;; CpxPE and w1118;; Syt 4PE) and syt 4BA1 nulls (w1118;; syt 4BA1). Representative traces of minis are also shown for control animals pre-treated with the PKA-specific inhibitor H89. (B) Mean mini frequency plotted as a function of time. Tetanic stimulation occurs at the 0 sec time point (Red Arrow). Mini frequency is normalized to average baseline mini frequency 60 seconds prior to stimulation for each preparation. (C) Average fold enhancement of mini frequency compared to baseline mini frequency 100 seconds after tetanic stimulation. Statistically significant differences in fold enhancement of minis were observed in control animals compared to syt 4BA1 nulls and H89 treated controls at each indicated time point starting at 100 seconds following HFMR stimulation up to 300 seconds, when minis started to return to pre-stimulus baseline mini frequency. (D) Pseudo-color activity heatmaps showing the distribution of spontaneous fusion rates for individual release sites at the same NMJ of muscle 4 prior (left panel) and after (right panel) tetanus stimulation. Each circle is a single region of interest (ROI) that represents the detection of a release event indicated by postsynaptic myrGCaMP6s fluorescence. Color-coding in the heatmaps indicate the number of mini events detected over a period of 2 minutes before and after HFMR stimulation. (E) Number of ROIs exhibiting indicated event frequency before (black) and after (magenta) HFMR stimulation (F) Representative images of Ca++ dynamics detected by presynaptic myrGCAMP6s expression before, during, and after stimulation. (G) Mean fluorescence change as a function of time during tetanus is shown for one representative NMJ stimulation trial. Red arrows indicate each 100 Hz stimulation event. Mean ± SEM is indicated. Indicated comparisons were made using ANOVA with post hoc Tukey analysis.

