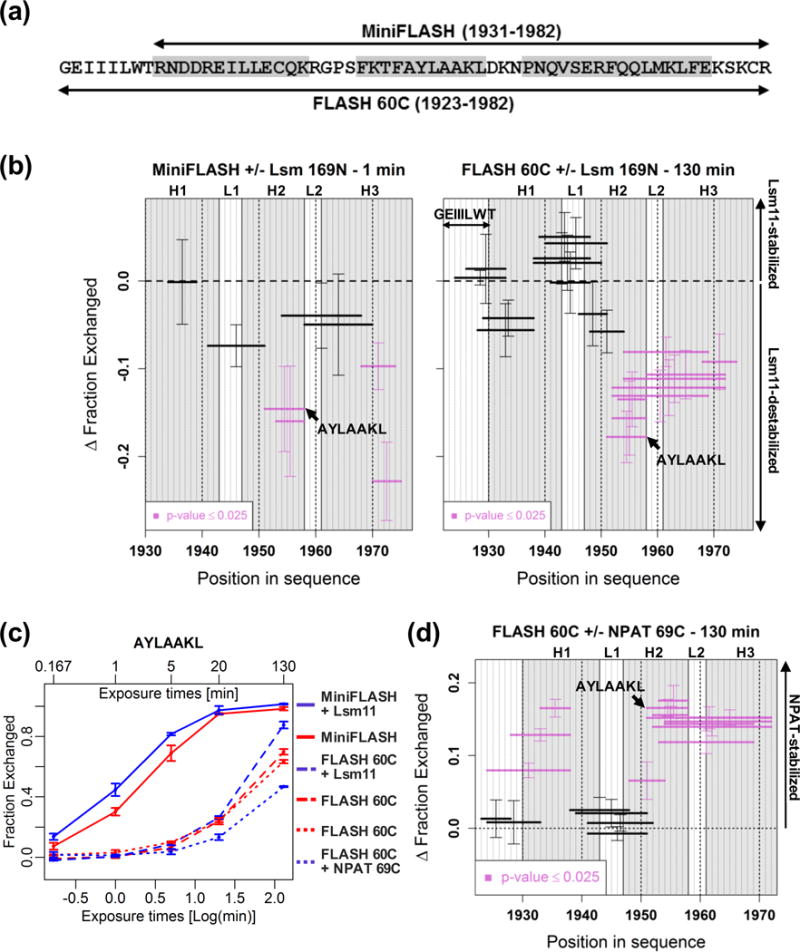
Fig. 4. Different effects of Lsm11 and NPAT binding on the SANT/Myb-like domain.

A. Amino acid sequence of the C-terminal region of FLASH in MiniFLASH (top) and FLASH 60C (bottom). Predicted α-helical structures are shown in grey. B. Differential plots of H/D exchange within the C-terminal domain of FLASH in MiniFLASH (left panel) and FLASH 60C (right panel). Δ Fraction Exchanged was calculated as described in Fig. 3B. α-helical structures (H1, H2 and H3) are marked in grey. Loop regions are indicated with L1 and L2. Positive and negative values indicate stabilization and destabilization of the C-terminal FLASH region, respectively. C. Kinetic plots of H/D exchange for the 1952AYLAAKL1958 peptide in MiniFLASH and FLASH 60C, either in the apo-state (red) or in a complex with Lsm 169N or NPAT 69C (blue), as indicated. D. Differential plots of H/D exchange for FLASH 60C bound to equimolar amounts of NPAT 69C after 130 min incubation in D2O buffer.
