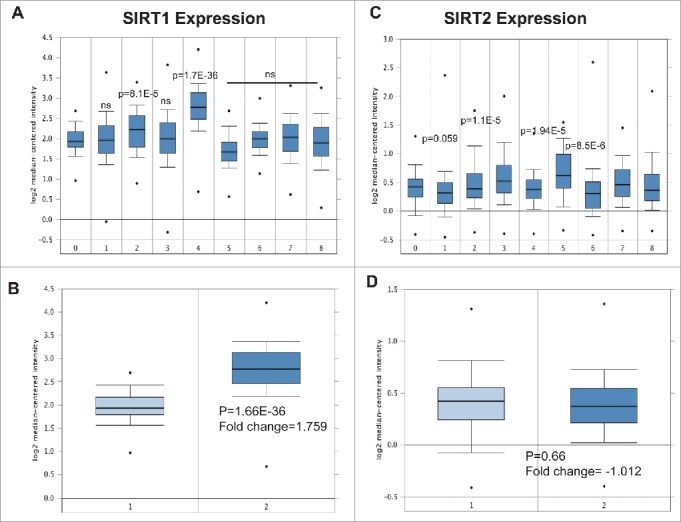
Figure 1.

Expression of SIRT1 and SIRT2 mRNA in leukemia revealed by data mining of the Oncomine gene expression database. (A) SIRT1 expression in leukemia cells compared with normal PBMC using the Haferlach leukemia dataset from the Oncomine database (https://www.oncomine.org/resource/login.html). 0) Normal PBMC (n = 74). 1) Acute Myeloid Leukemia (n = 542), 2) B-Cell Acute Lymphoblastic Leukemia (n = 147), 3) B-Cell Childhood Acute Lymphoblastic Leukemia (n = 359). 4) Chronic Lymphocytic Leukemia (n = 448). 5) Chronic Myelogenous Leukemia (n = 76) 6) Myelodysplastic Syndrome (n = 206). 7) Pro-B Acute Lymphoblastic Leukemia (n = 70). 8) T-Cell Acute Lymphoblastic Leukemia (n = 174). (B) Differential expression of SIRT1 in normal PBMC and CLL cells obtained from the Haferlach data set. 1) Peripheral Blood Mononuclear Cell (n = 74) 2) Chronic Lymphocytic Leukemia (n = 448). (C) SIRT2 expression in leukemia cells comparing with normal PBMC using the Haferlach leukemia dataset. (D) Differential expression of SIRT2 in normal PBMC and CLL cells obtained from the Haferlach data set. 1) Peripheral Blood Mononuclear Cell (n = 74) 2) Chronic Lymphocytic Leukemia (n = 448). The error bars represent SDs of mean, and statistically significant differences (by Student t test) between normal PBMC and leukemia are indicated by p-value.
