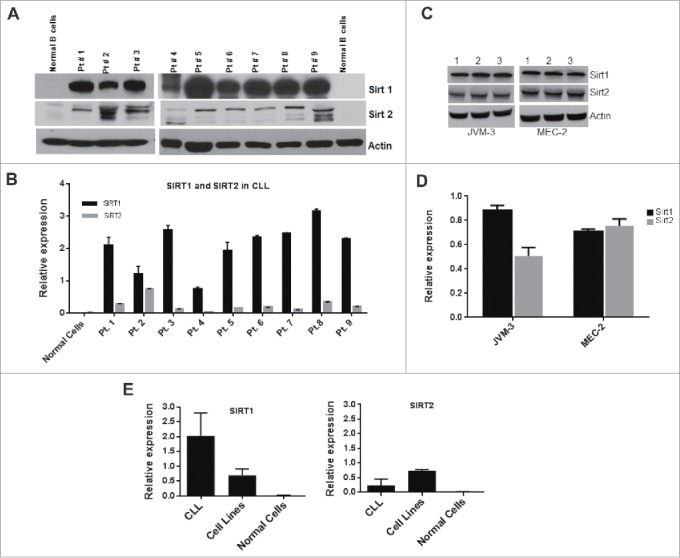
Figure 2.

SIRT1 and SIRT2 is overexpressed in CLL primary cells and cell lines. (A) Expression level of SIRT1 and SIRT2 proteins was determined by Western blotting of PBMC obtained from CLL patients and normal B cells. (B) Quantitative estimation of SIRT1 and SIRT2 obtained by measuring band density of Western blots in Fig. 1A using Image-J software. Relative expression denotes values of SIRT1 or SIRT2 in relation to Actin. (C) Expression level of SIRT1 and SIRT2 protein in JVM-3 and MEC-2 cell lines. Western blot of cell lysates obtained from JVM-3 and MEC-2 cell line. Samples were loaded in triplicate for statistical analysis. (D) Quantitative estimation of SIRT1 and SIRT2 protein in JVM-3 and MEC-2 cell lines obtained from Fig. 2C. (E) Graphic presentation of SIRT1 and SIRT2 in grouped samples of CLL and cell lines. Actin is used as an internal control on all Western blots. The error bars represent standard deviation (SD) of mean.
