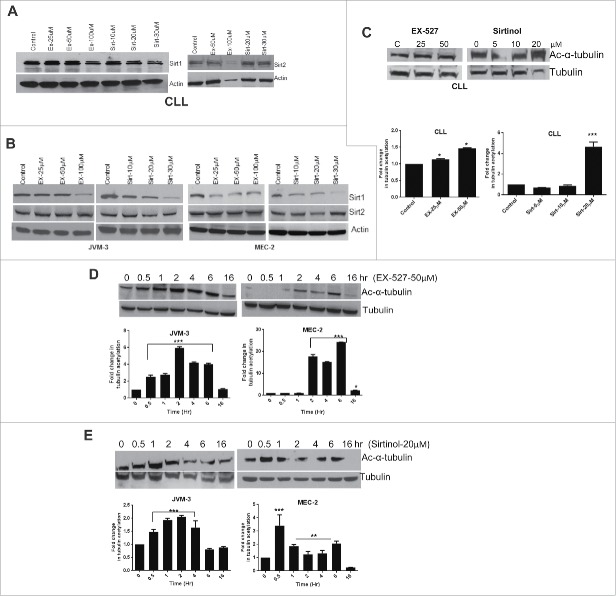
Figure 4.
Sirt inhibitors impair SIRT1 protein expression and de-acetylation activity. (A) Western blots showing expression of SIRT1 and SIRT2 proteins in CLL cells following exposure to indicated concentrations of EX-527 and Sirtinol for 24 hr. (B) JVM3 and MEC-2 cell lines were treated with EX-527 or sirtinol followed by Western blotting using specific antibodies for SIRT1 and SIRT2. (C) CLL cells were treated with indicated concentrations of EX-527 or sirtinol for 6 hr. followed by cell lysis and Western blotting using specific antibodies for acetyl-α tubulin and total tubulin. Bar graph shows the fold change in tubulin acetylation as measured by quantitation of band densities from the Western blot in Fig. 3C using image-J. (D) JVM-3 and MEC-2 cell lines were treated with 50 µM EX-527 or 20 µM sirtinol (E) and samples were collected at the indicated time points. Western blot was performed using specific antibodies for acetyl-α tubulin and total tubulin. Bar graph shows the fold change in tubulin acetylation. Total tubulin is used for normalization. The error bars represent SDs of mean and statistically significant differences (by Student t test) in between control and treatment over time are indicated by an asterisk (*, P< 0.01, **, P < 0.001; ***, P < 0.0001).

