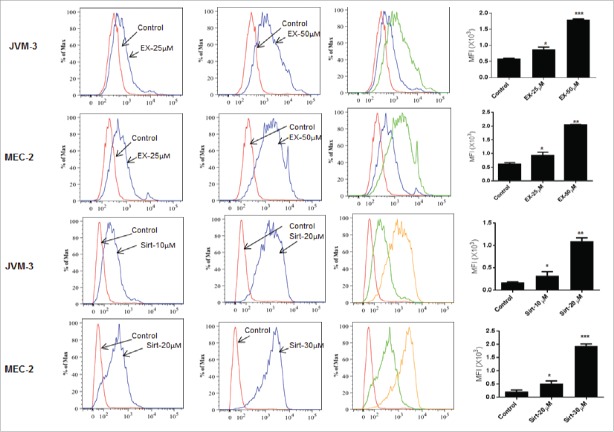
Figure 5.
Generation of intracellular ROS. JVM3 and MEC-2 cells were treated with EX-527 for 16 hr. and sirtinol for 30 minutes followed by 30 min incubation with 2.5 µM MitoSOX red and flow cytometry. Histograms next to the graph overlays show mean fluorescence intensity (MFI). The error bars represent SDs of mean and statistically significant differences (by Student t test) in between control and treatment are indicated by an asterisk (*, P < 0.01, **, P < 0.001; ***, P < 0.0001).

