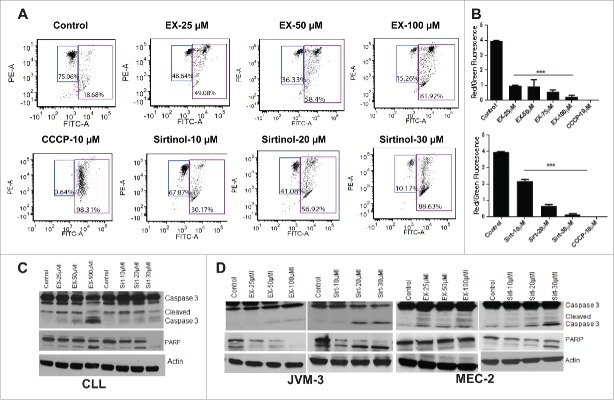
Figure 6.
Sirtuin inhibitors induce mitochondrial depolarization and caspase activation. (A) CLL cells were treated with indicated concentrations of EX-527 and sirtinol for 16 hr. followed by JC-1 staining and flow cytometry to measure MMP as described in materials and methods. Figures are representatives of 3 independent experiments. Values in the left quadrant represent cells with intact MMP. CCCP is used as positive control. (B) The bar graph is obtained from Fig. 6A, and represents the mean value of 3 replicates ± SD of A. * indicates significant difference from the corresponding control. The error bars represent SDs of mean and statistically significant differences (by Student t test) in between control and treatment is indicated by an asterisk (***, P < 0.0001). (C) CLL cells and (D) JVM-3 and MEC-2 cells were treated with indicated concentrations of EX-527 and sirtinol for 6 hr. followed by cell lysis and protein gel blotting using specific antibodies for caspase 3 and PARP. Actin is used as an internal control.

