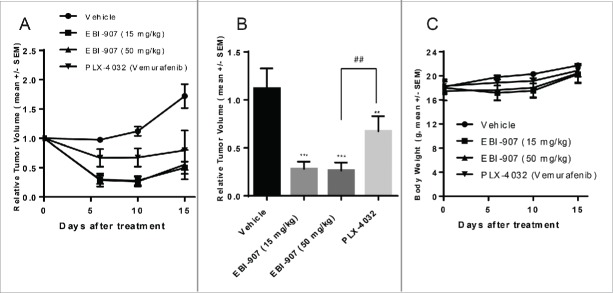
Figure 6.
Effect of BRAF inhibitors on tumor growth in the A-375 xenograft mice model. (A) tumor growth curve in mice bearing A-375 xenograft treated with daily dosing of compounds (p.o, twice a day) for 15 d (B) The relative volume of tumor xenografts on day 10 after treatment. (C) The body weight of mice during the course of treatment. Data were expressed as mean ± SE (n = 7 to 8) **P<0.01, ***P<0.001 vs. Vehicle; ##P<0.05.

