
Figure 3.
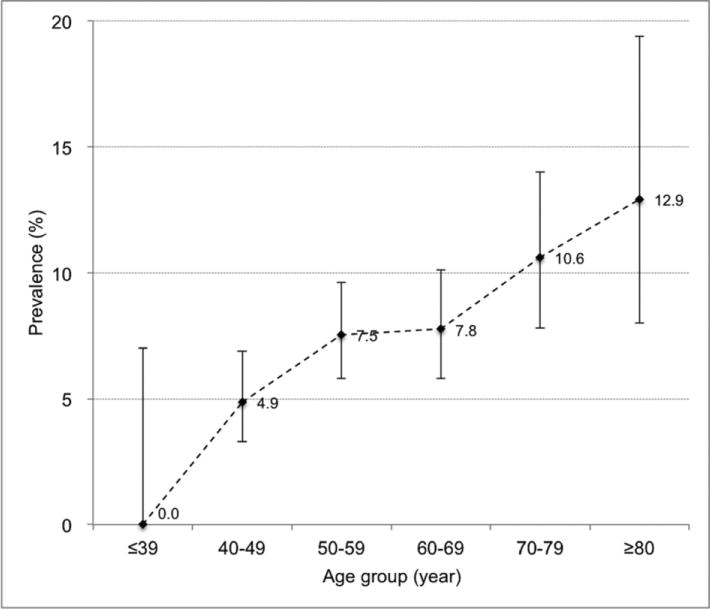
Prevalence of pulmonary cysts in association with age. Plotted dots indicate the prevalence in each age group. Vertical lines extending from each plot represent 95% CI (confidence interval) with horizontal lines at the top and bottom representing upper and lower limits, respectively.