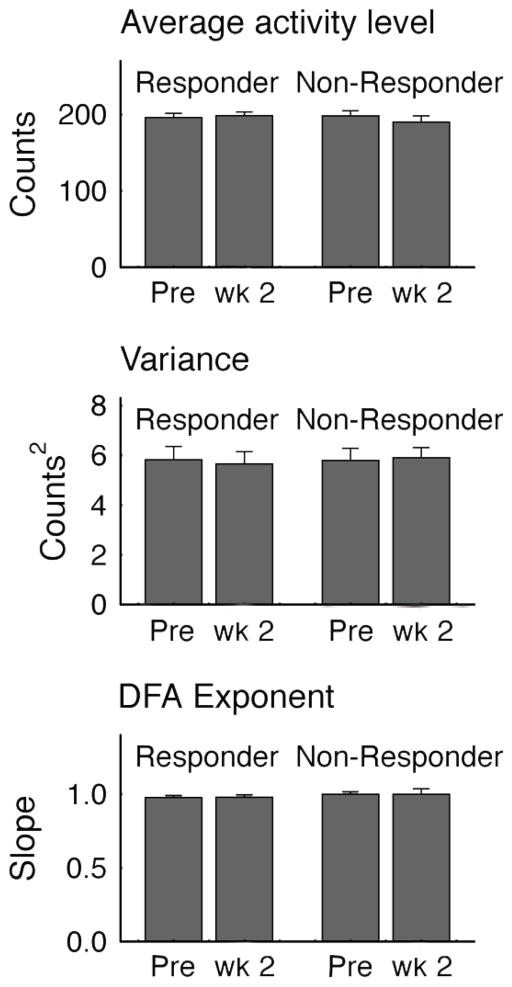
Figure 2. Measures of average activity, variance and global scaling.
Differences between light-therapy responders versus non-responders in average activity counts per minute, the average within subject variance and the global scaling exponent calculated by the detrended fluctuation analysis (DFA) [18]. Vertical bars represent S.E.M. There were no significant differences in any of the values between responders and non-responders.

