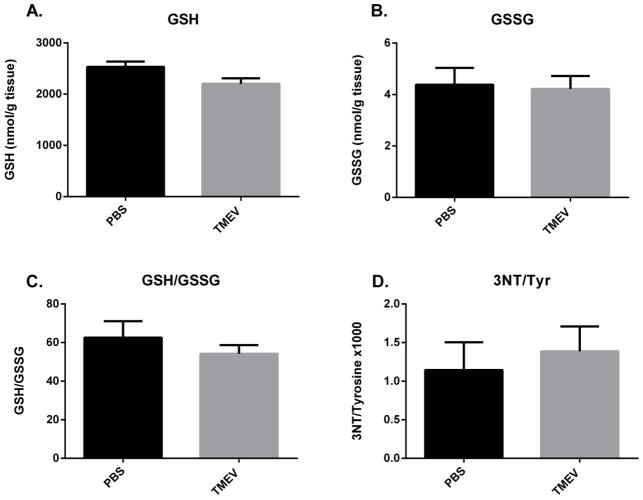
Figure 4. No oxidative stress in cerebellum of TMEV mice at 3 dpi.
Mice were injected with PBS or TMEV and GSH, GSSG, 3NT and Tyr levels were measured at 3dpi with HPLC-EC (n=5 mice per group). GSH and GSSG levels are presented as nmols/gram tissue and as the ratio of GSH/GSSG. 3NT levels are presented as the ratio of 3NT to tyrosine (3NT/Tyr × 1000). All data is represented as values ± S.E.M. Statistical analysis used here was an unpaired t-test.

