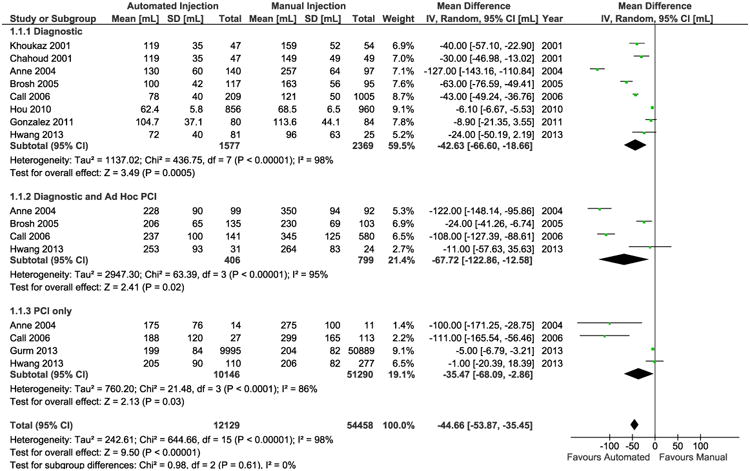
Figure 2. Meta-analysis of Contrast Volume Use.

The forest plot graphs the weighted mean difference in contrast volume use between manual injection and ACIs devices stratified by type of procedure each with a sub-group summary estimate (black diamond) and a final summary estimate at the bottom for all types of procedure. The small boxes and horizontal lines depict the weighted mean difference for contrast volume for each listed study.
