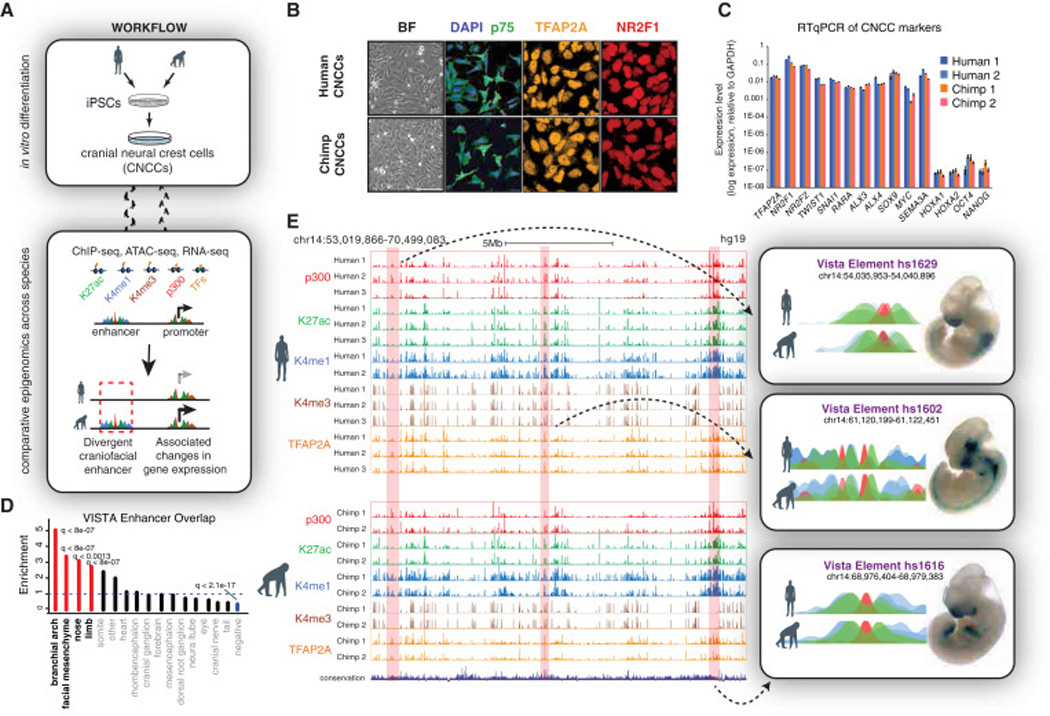
Figure 1. Derivation of human and chimpanzee CNCCs and epigenomic annotation of craniofacial enhancers.

(A) Workflow of comparative epigenomic strategy.
(B) Confocal immunofluorescence detection of NC markers p75, TFAP2A, and NR2F1 in human and chimp CNCCs at passage 4.
(C) RT-qPCR of NC markers, HOXs and pluripotency markers OCT4 and NANOG in derived human and chimp CNCCs from 2 genetic backgrounds of each species.
(D) Enrichment of annotated expression domain categories from overlap of top 15,000 enhancer calls with regions in the VISTA enhancer database. P-values were calculated with Fisher’s exact test and corrected for pFDR. Categories with q-value < 0.05 are indicated in red (enrichment) or blue (depletion).
(E) Representative UCSC Genome Browser tracks showing ChIP-seq profiles for p300 (red), H3K27ac (green), H3K4me1 (blue), H3K4me3 (brown), and TFAP2A (orange) from both species aligned to hg19 reference genome. Representative elements tested through the VISTA enhancer database (Visel et al., 2007) displayed on the right next to the reported lacZ expression domains.
