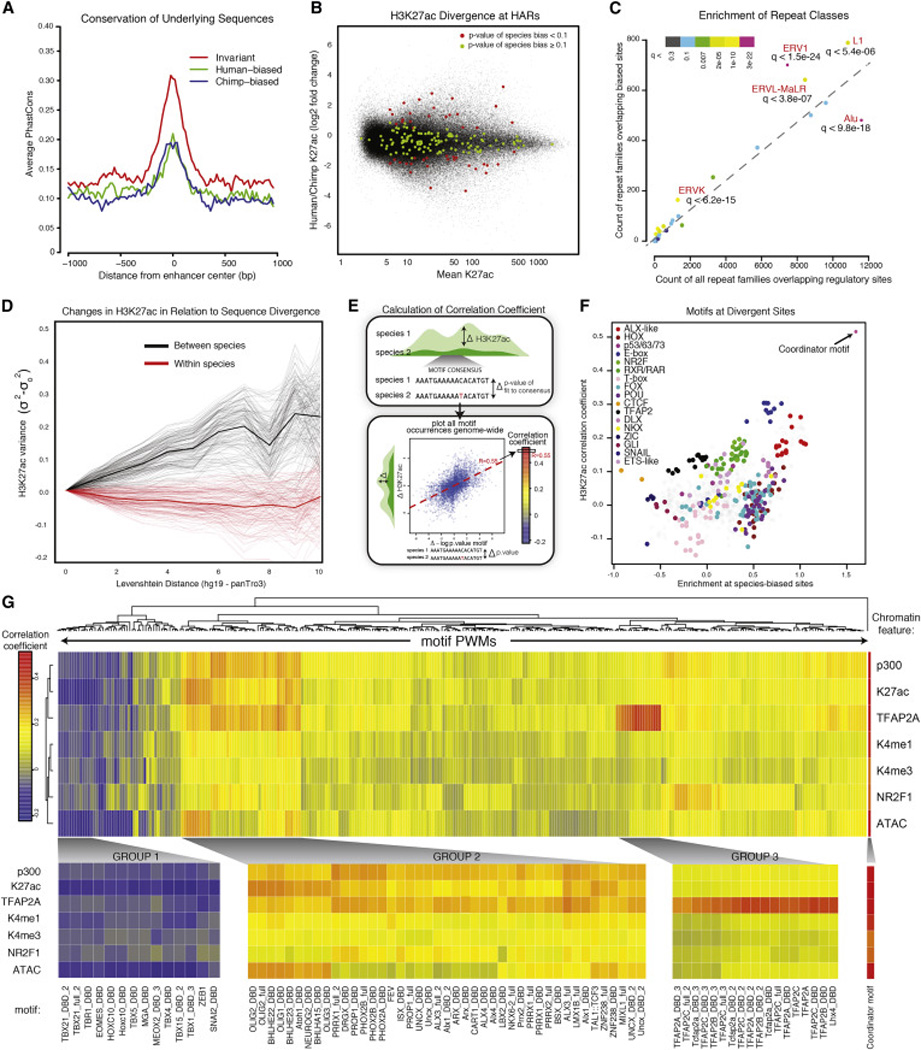
Figure 4. Global features of species-biased enhancers and correlation of mutations within TF binding motifs with epigenomic divergence.

(A) Average PhastCons scores are shown for strong invariant enhancers (q-value > 0.98), strongly human-biased enhancers (q value < 0.0001) or strongly chimp-biased enhancers (q-value <0.0001) for 1kb surrounding each enhancer center.
(B) Degree of species bias (log2 fold change H3K27ac human/chimp, y axis) relative to enhancer strength (human-chimp averaged H3K27ac enrichment, x axis) for bulk CNCC elements (black) and elements overlapping HARs (color representing q-value of species-bias: q-value < 0.1 in red, q-value ≥ 0.1 in green).
(C) Counts of repeat families overlapping species-biased enhancers (y axis) relative to counts of repeat families overlapping all regulatory sites (x axis) are plotted. Q-score of enrichment for different repeat classes indicated by color.
(D) Pairwise H3K27ac variance σ2-σ2ld=0 at enhancers across samples, ranked by increasing sequence dissimilarity counted by Levenshtein distance (ld) between orthologous 200bp enhancers, relative to ld = 0. Comparison between samples of different species shown in black, same species shown in red (means represented by thick lines).
(E) Schematic showing method for deriving the correlation coefficient. For a given motif, each occurrence genome-wide containing a genetic change across species is plotted as Δ-log10 p-value (human/chimp) of the fit to consensus (x axis) vs. ΔH3K27ac for the overlying enhancer region (human/chimp) (y axis), then a line is fit. The slope of the line represents the correlation coefficient for that given motif and epigenomic modification genome-wide.
(F) Enrichments of classes of motifs at species-biased enhancers over all enhancers (log odds ratio, x axis) plotted relative to genome-wide correlation coefficient calculated for each motif (using H3K27ac), as described in panel E (y axis).
(G) Genome-wide correlation coefficients were calculated for whole databases of annotated motifs and multiple chromatin features, revealing motifs with large influence on epigenomic profiles. Correlation coefficients are bi-clustered per motif, and resulting changes in enrichment of chromatin features (p300, K27ac, TFAP2A, H3K4me1, H3K4me3, NR2F1, ATAC) at all enhancers containing mutated PWMs are represented by color. Individual subclusters are magnified below with corresponding motifs indicated.
