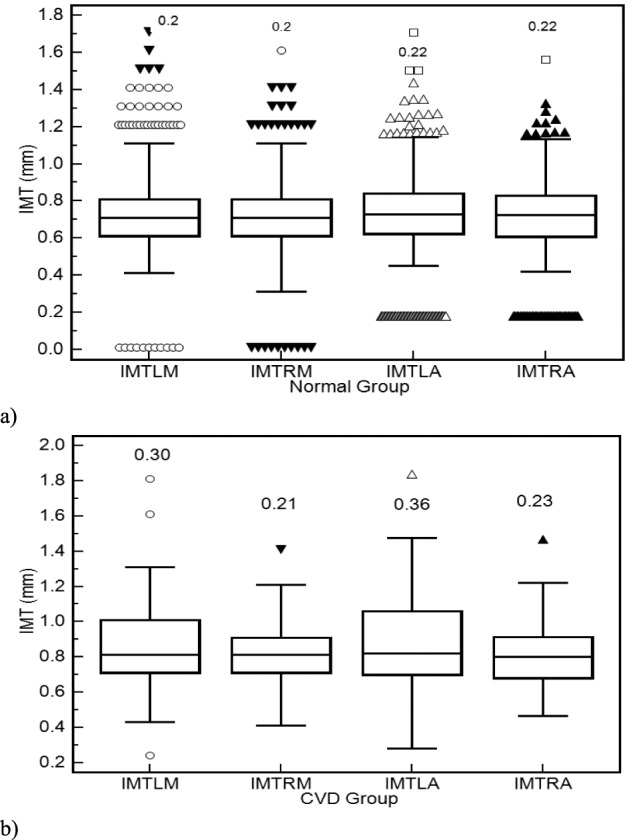
FIGURE 2.

Box plots for the left and right CCA IMT manual measurements (IMTLM, IMTRM) and automated measurements (IMTLA, IMTRA) for a) normal and b) CVD groups respectively. Inter-Quartile Range (IQR) values are shown above the box plots. Straight lines connect the nearest observations with 1.5 of the IQR of the lower and upper quartiles. Unfilled circles, inverted filled triangles, unfilled triangles and filled triangles correspond to outliers with values beyond the ends of the 1.5xIQR; whereas filled inverted triangles, unfilled circles and unfilled squares correspond to outliers within 2.5XIQR and 3.5xIQR respectively.
