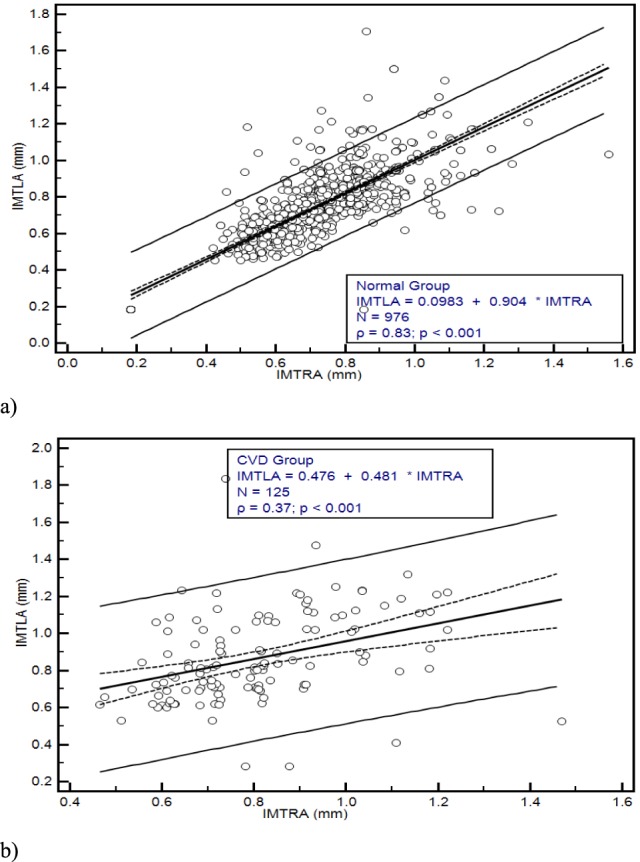
FIGURE 4.

Regression lines for the automated IMTLA versus IMTRA in (mm) with confidence interval limits of ±0.21 and confidenece intervals for the correlation coeficient (dashed) for a) the Normal Group, and b) the CVD Group of all subjects investigated in this study.
