
Figure 3.
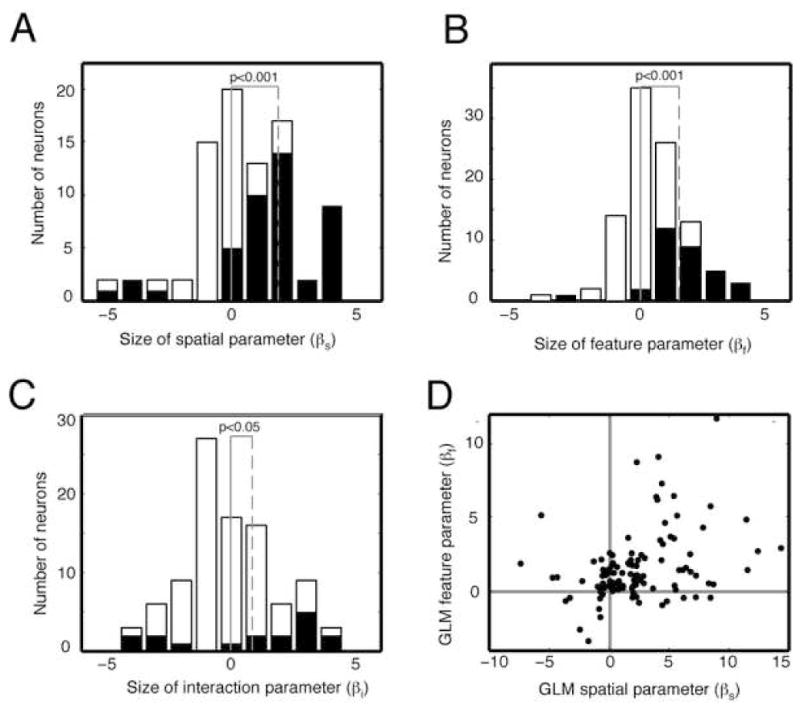
Effects of spatial and feature-based attention and their interaction for all neurons. A. Histogram of GLM parameters for spatial attention for all 110 neurons in the sample. Positive numbers indicate neurons whose firing rate is enhanced by spatial attention. Black bars indicate neurons with significant attentional modulation. Vertical gray line indicates zero; vertical dashed line indicates mean of distribution. B. Histogram of GLM parameters for feature-based attention, format same as panel A. C. Histogram of GLM parameters for the interaction of spatial and feature-based attention. Neurons to the right of zero have a super-additive interaction. The distribution is shifted significantly to the right. D. Scatter plot showing relative size of parameters for spatial and feature-based attention. These two variables are significantly correlated (correlation coefficient 0.33, p<0.01, bootstrapped correlation test).