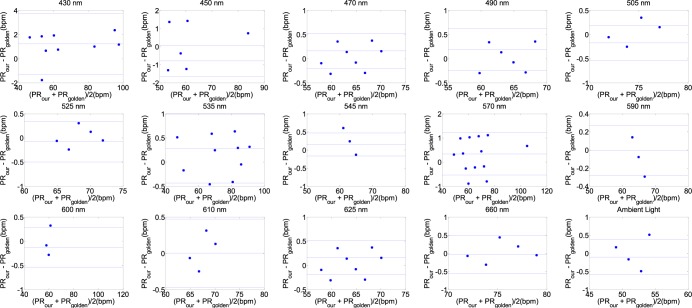
FIGURE 4.
Bland-Altman plot is applied to agreement analysis between PPGi and gold standard from the G channels for 430nm, 450nm, 470nm, 490nm, 505nm, 525nm, 535nm, 545nm, 570nm, 590nm, 600nm, 610nm, 625nm, 660nm and white light respectively, which reflect PR measurement. The solid lines are the mean of differences, and the broken lines represent the upper and lower limits of agreement, i.e., +1.96 SD and −1.96 SD, respectively. SD is standard deviation. These representative data are from male, age 30 years old.

