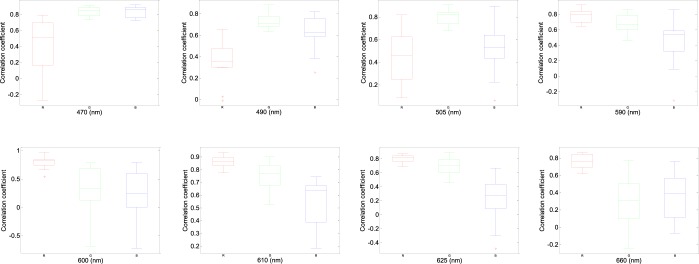
FIGURE 6.
Box-and-whisker plot showing better correlation coefficients from in the RGB channels with minimum light intensity for (68%), 490 nm (38%), 505 nm (48%), 590 nm (9%), 600 nm (4%), 610 nm (3.8%), 625 nm (3.5%) and 660nm (2%) wavelengths. The red cross are drawn as outliers if they are larger than  (q3 - q1) or smaller than q1 – 1.5(q3 - q1), where q1 and q3 are the 25th and 75th percentiles, respectively. These representative data are from twelve subjects.

