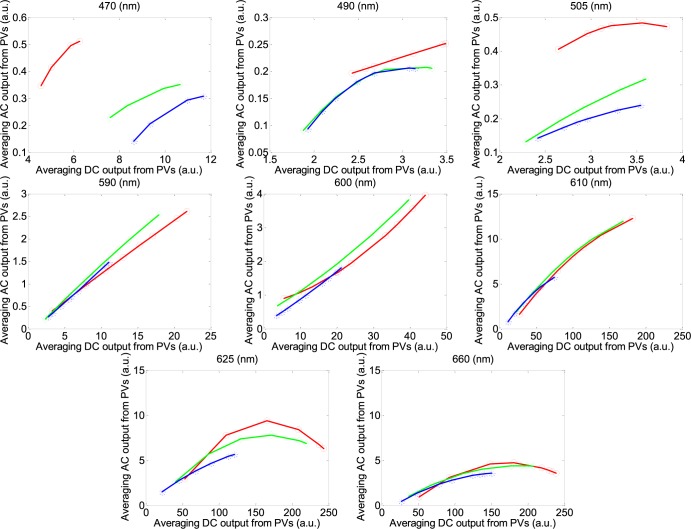
FIGURE 7.
The fitted curve of PPGi amplitudes in the RGB channels with different light intensity for 470 nm, 490 nm, 505 nm, 590 nm, 600 nm, 610 nm, 625 nm, 660 nm wavelengths and white light. X-axes represent averaging DC output form pixels and y-axes represent averaging AC output form pixels. These representative data are from male, age 30 years old.

