FIGURE 8.

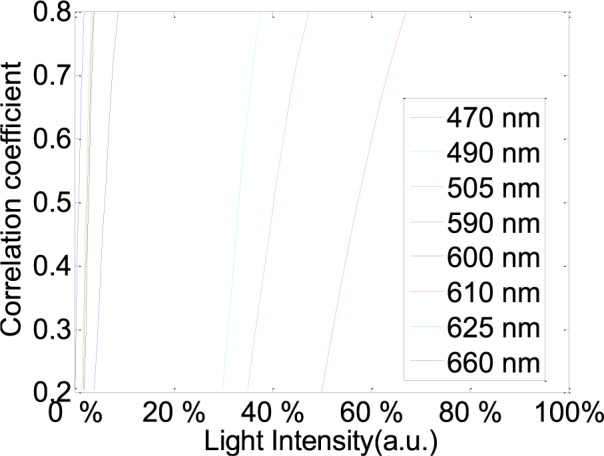
Correlative coefficient fitting curves in different intensity spectra for 470 nm, 490 nm, 505 nm, 590 nm, 600 nm, 610 nm, 625 nm and 660 nm wavelength lights. These representative data are from twelve subjects.

Correlative coefficient fitting curves in different intensity spectra for 470 nm, 490 nm, 505 nm, 590 nm, 600 nm, 610 nm, 625 nm and 660 nm wavelength lights. These representative data are from twelve subjects.