FIGURE 9.

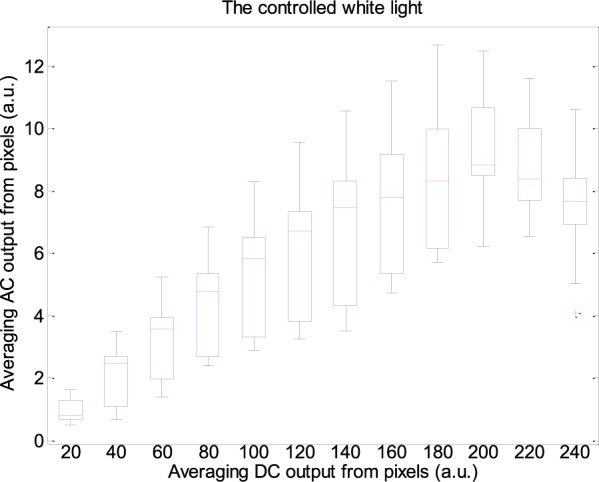
Box-and-whisker plot showing AC amplitudes changes with DC amplitude in white light. These representative data are from twelve subjects.

Box-and-whisker plot showing AC amplitudes changes with DC amplitude in white light. These representative data are from twelve subjects.