. 2016 Mar 15;5:e13152. doi: 10.7554/eLife.13152

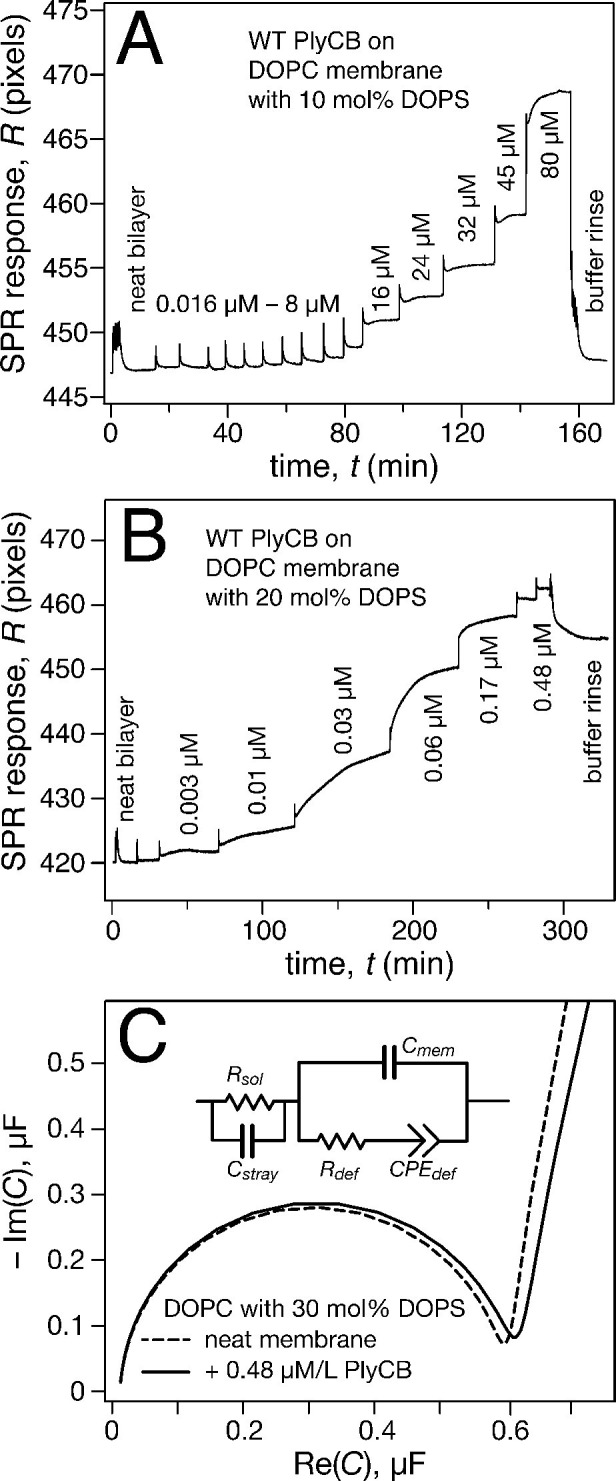
Figure 4. PlyCB binds to PS-containing membranes.

PlyCB in 150 mM NaCl at pH 7.4 was characterized on surface-ligated DOPC-based stBLMs with PS at various concentrations and its impact on membrane structure monitored with EIS. (a,b) Binding of PlyCB to stBLMs with 10 and 20 mol% DOPS, respectively. Each spike indicates an injection with an increased concentration of protein. A final buffer rinse removed the adsorbed protein quantitatively on 10 mol% PS, but only partially on 20 mol% PS, indicating that the association of the protein with the membrane surface differed depending on PS concentration. (c) Raw EIS spectra (Cole-Cole plots) of an stBLM (20 mol% DOPS) as prepared (dashed line) and after incubation with 480 nM PlyCB (solid line). Fitted parameters (equivalent circuit model, see inset), corrected for electrode surface size, are given in Table 1.
DOI: http://dx.doi.org/10.7554/eLife.13152.009

Figure 4.

Figure 4—figure supplement 1. Effects of soluble GAGs or GAG lyases on internalization of PlyC.
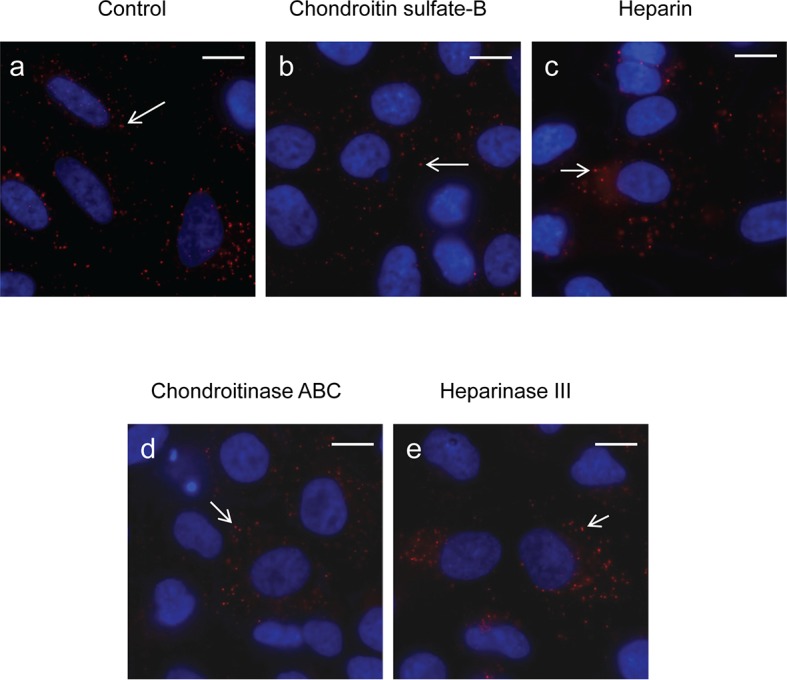
Figure 4—figure supplement 1.

(a) A549 epithelial cells were incubated with PlyCB-AlexaFluor555 (red) in serum-free medium F12K for 30 min at 37ºC, fixed by 4% PFA in PBS and stained with DAPI (nucleus, blue). (b) Cells were pre-treated with 50 μg/ml of chondroitin sulfate-B for 30 min then incubated with PlyCB-AlexaFluor555 before being fixed and stained with DAPI. (c) Cells were pre-treated with 100 IU/ml of heparin for 30 min then incubated with PlyCB-AlexaFluor555 before being fixed and stained with DAPI. (d) Cells were pre-treated with 20 mIU/ml of chondroitinase ABC for 1 hr then incubated with PlyCB-AlexaFluor555 before being fixed and stained with DAPI. (e) Cells were pre-treated with 5 mIU/ml of Heparinase III for 1 hr then incubated with PlyCB-AlexaFluor555 before being fixed and stained with DAPI. Arrows indicate the internalized PlyCB. Scale bar is 10 μm.
Figure 4—figure supplement 2. Assessment of PlyCB binding to phospholipids using a PIP Strip array.
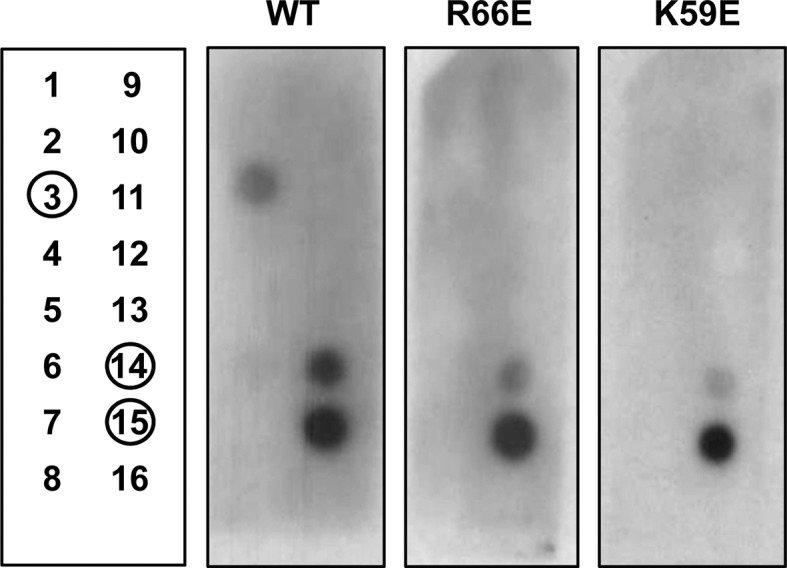
Figure 4—figure supplement 2.

Layout of phospholipids used in the phospholipid arrays (left panel) and binding results of His-tagged WT PlyCB, PlyCBR66E, and PlyCBK59E. The blot was developed with the LumiSensor Chemiluminescent HRP Substrate Kit while using Mouse Anti-His mAb followed by Goat Anti-Mouse IgG [HRP]. Legend: 1, lysophosphatidic acid (LPA); 2, lysophosphocholine (LPC); 3, phosphatidylinositol (PI); 4, phosphatidylinositol-3-phosphate (PI3P); 5, phosphatidylinositol-4-phosphate (PI4P); 6, phosphatidylinositol-5-phosphate (PI5P); 7, phosphatidylethanolamine (PE); 8, phosphatidylcholine (PC); 9, sphingosine-1-phosphate (S1P); 10, phosphatidylinositol-3,4-bisphosphate (PI(3,4)P2); 11, phosphatidylinositol-3,5-bisphosphate (PI(3,5)P2); 12, phosphatidylinositol-4,5-bisphosphate (PI(4,5)P2); 13, phosphatidylinositol-3,4,5-trisphosphate (PI(3,4,5)P3); 14, phosphatidic acid (PA); 15, phosphatidylserine (PS), 16, blank.