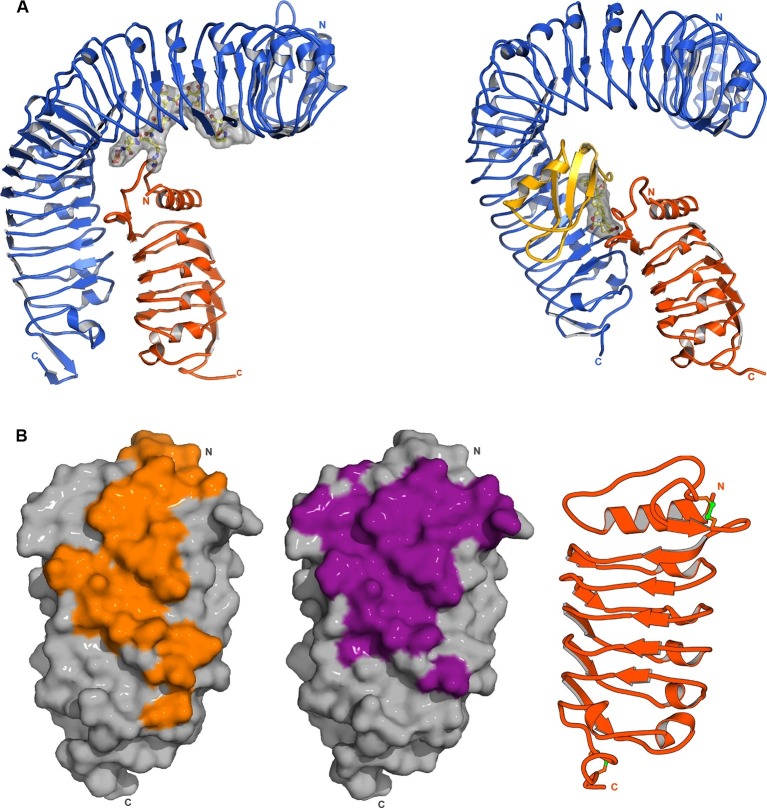
Figure 6. SERK1 uses partially overlapping surface areas to activate different plant signaling receptors.
(A) Structural comparison of plant steroid and peptide hormone membrane signaling complexes. Left panel: Ribbon diagram of HAESA (in blue), SERK1 (in orange) and IDA (in bonds and surface represention). Right panel: Ribbon diagram of the plant steroid receptor BRI1 (in blue) bound to brassinolide (in gray, in bonds representation) and to SERK1, shown in the same orientation (PDB-ID. 4lsx) (Santiago et al., 2013). (B) View of the inner surface of the SERK1 LRR domain (PDB-ID 4lsc (Santiago et al., 2013), surface representation, in gray). A ribbon diagram of SERK1 in the same orientation is shown alongside. Residues interacting with the HAESA or BRI1 LRR domains are shown in orange or magenta, respectively.

