. 2016 Apr 27;5:e11154. doi: 10.7554/eLife.11154

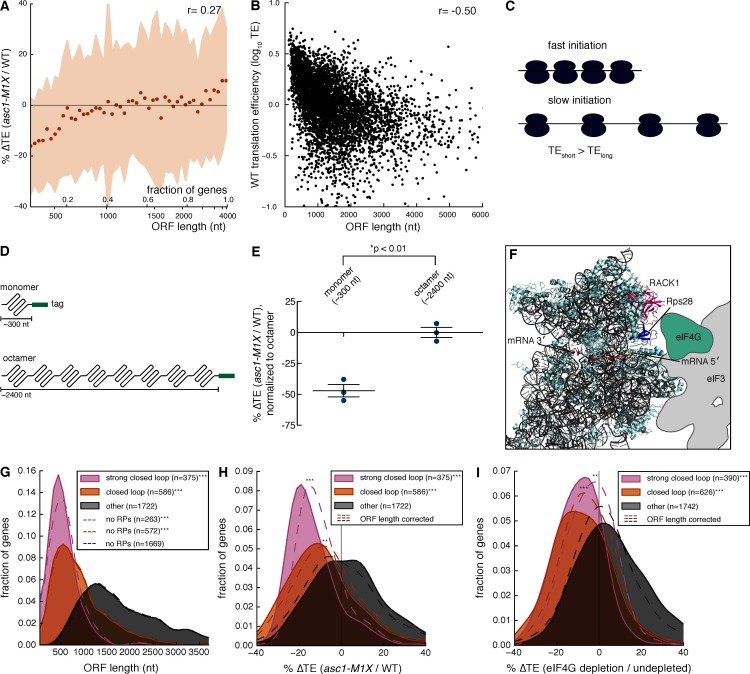
Figure 3. Asc1 is required for efficient translation of short ORFs that form closed loop complexes.

(A) Relationship between ORF length and TE changes in asc1-M1X. The values shown represent the average percent change in TE for bins of 100 genes arranged by length. The ORF lengths shown correspond to the point at which the average ORF length of the bin exceeds the indicated value. Shaded areas represent +/- 1 s.d. from the average change. The ASC1 gene is excluded from the plot. (B) Relationship between ORF length and translational efficiency in WT yeast cells (data from this study). The Spearman correlation coefficient is shown. (C) Model showing the expected effect of a higher initiation rate on short mRNAs compared to long mRNAs on translation efficiency measurements. (D) Diagram of ORF length reporter constructs. The I27 monomer was repeated to make the octamer and each ORF was fused to a C-terminal V5 epitope tag. (E) Result of ORF length reporter experiment. TE is calculated as the normalized protein (V5 tag/Pgk1) to mRNA ratio (V5 mRNA/18S) and the ∆TE (ratio between mutant and WT) is shown. Relative protein concentration was obtained from quantitative Western blotting and mRNA concentration from qRT-PCR. *p=0.002, two-tailed Student’s t-test (monomer vs. octamer). Error bars are SEM from 3 biological replicates derived from independent genetic isolates of asc1-M1X. (F) The structure of the mammalian 48S pre-initiation complex is shown (Lomakin and Steitz, 2013) with the mRNA, RACK1, and Rps28, which crosslinks to the -7 and -10 positions of the mRNA relative to the AUG (Pisarev et al., 2008), indicated. The outline of eIF3 from Hashem et al. (2013) is shown. eIF4G is placed on the left arm of eIF3 based on electron microscopy data from Siridechadilok et al. (2005). (G, H, I) The relationship between closed loop complex association and ORF length (p=10–172and 10–135 for strong closed loop and closed loop groups vs. other mRNAs, respectively) (G), ∆TE in asc1-M1X (p=10–71and 10–42 for strong closed loop and closed loop vs. other mRNAs, respectively) (H), and ∆TE after eIF4G depletion (p=10–70and 10–73 for strong closed loop and closed loop vs. other mRNAs, respectively. Data from Park et al., 2011) (I). In (H) and (I), the dotted lines show the results after accounting for the relationship between ORF length and ∆TE using linear regression. For asc1-M1X, ORF length corrected p-values are 10–30 and 10–14 for strong closed loop and closed loop groups, respectively. For eIF4G depletion, ORF length corrected p-values are 10–17 and 10–28 for strong closed loop and closed loop groups, respectively. p-values are from the one-sided Mann-Whitney U test. Closed loop association groups are from Costello et al. (2015). For G-I, ***p<10–18, **p<10–9, *p<10–3

DOI: http://dx.doi.org/10.7554/eLife.11154.007

Figure 3.

Figure 3—figure supplement 1. Identification of properties of Asc1-sensitive mRNAs.

Figure 3—figure supplement 1.

Motif analysis of 5′ UTRs of mRNAs with decreased TE in asc1-M1X, defined as having a z-score ≤ -1. (motif present in 37/325 genes, E-value= 8.3e-11).
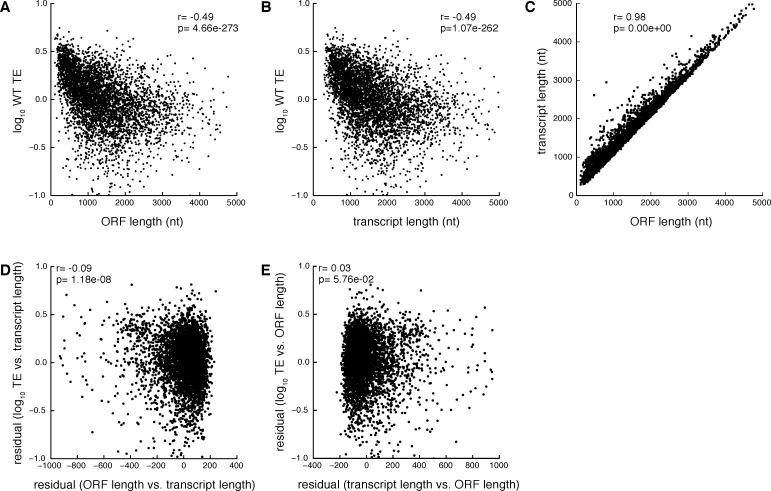
Figure 3—figure supplement 2. Partial correlation analysis showing the relationship between wild type ORF length, transcript length, and TE.

Figure 3—figure supplement 2.

(A) TE vs. ORF length (B) TE vs. transcript length (C) transcript length vs. ORF length (D) TE vs. ORF length, partial correlation controlling for transcript length (E) TE vs. transcript length, partial correlation controlling for ORF length. Spearman correlation coefficients are shown between the indicated values or the residuals after linear regression.
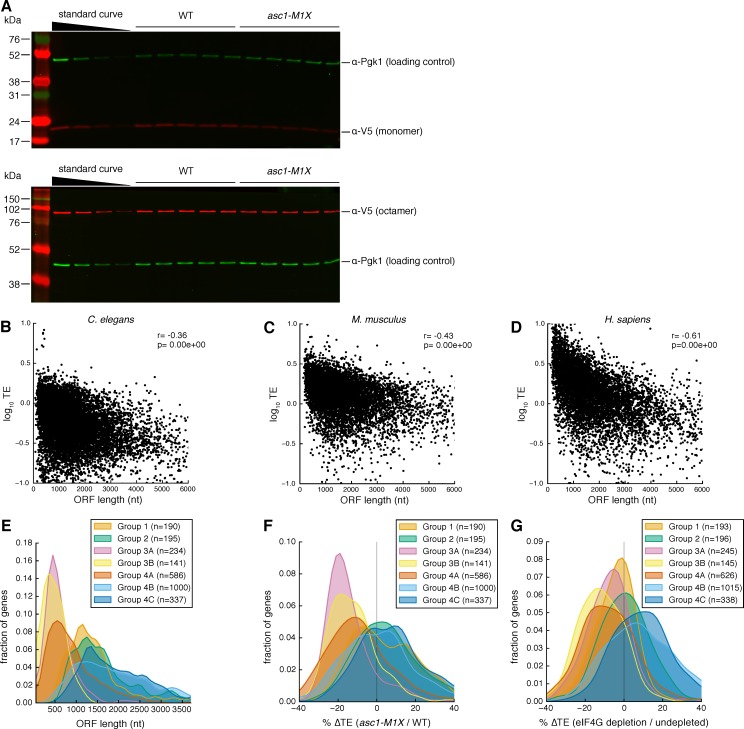
Figure 3—figure supplement 3. Evidence for ORF-length-dependent translational regulation.

Figure 3—figure supplement 3.

(A) Representative Western blots showing V5-tagged I27 monomer (top) or octamer (bottom) in WT and asc1-M1X cells. The standard curve is a two-fold dilution series of WT extract. Protein bands display variable brightness due to transfer efficiency and membrane binding differences between proteins of different molecular weights (Bolt and Mahoney, 1997). Therefore, we quantify the relative difference between mutant and WT at each protein size and cannot draw conclusions about absolute protein concentrations across the molecular weight range from Western blotting analysis. (B–D) Scatterplots showing the relationships between TE and ORF length in diverse eukaryotes: C. elegans, dauer stage (Stadler and Fire, 2013) (B), M. musculus, neutrophils (Guo et al., 2010) (C), and H. sapiens, HeLa cells (Guo et al., 2010) (D). (E–G) The effect of closed loop complex association on ORF length as in Figure 3 (G–I) but with all groups from Costello et al. (2015), in which mRNAs were subdivided by hierarchical clustering into groups with similar translation factor enrichment profiles. For Figure 3 (G–I), Group 3A and 3B were combined and labeled ‘strong closed loop’. Group 4A was labeled ‘closed loop’ and all other groups were combined and labeled ‘other’ based on their association with closed-loop factors eIF4E, eIF4G, and Pab1, and de-enrichment with 4E-binding protein (4E-BP) repressors whose association with an mRNA should be mutually exclusive with the closed loop complex. Group 3A and 3B consist of mRNAs enriched for the closed loop factors and de-enriched for the 4E-BPs. Group 4A is similarly enriched for the closed loop factors but not de-enriched for the 4E-BPs. Groups in the ‘other’ category either show enrichment for the 4E-BPs or de-enrichment for the closed loop factors.
Figure 3—figure supplement 4. Relationship between ORF length and changes in mRNA polysome association after eIF4G depletion (data from Park et al., 2011).

Figure 3—figure supplement 4.

Plot parameters are as described for Figure 3A. The genes encoding the two eIF4G isoforms are excluded from the plot.