
FIGURE 5.
Results
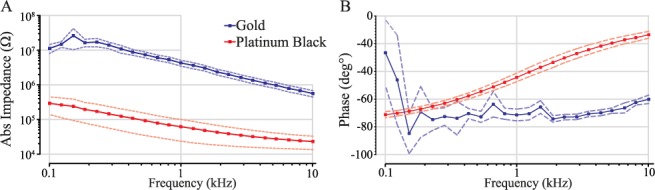
of the in vitro impedance analysis. The absolute impedance
(A) and the phase shift (B) were plotted vs frequency. The solid line shows
the mean,  ,
and the dashed line shows the 95% confidence interval.
,
and the dashed line shows the 95% confidence interval.
Official websites use .gov
A
.gov website belongs to an official
government organization in the United States.
Secure .gov websites use HTTPS
A lock (
) or https:// means you've safely
connected to the .gov website. Share sensitive
information only on official, secure websites.
Results
of the in vitro impedance analysis. The absolute impedance
(A) and the phase shift (B) were plotted vs frequency. The solid line shows
the mean, ,
and the dashed line shows the 95% confidence interval.