Figure 1.

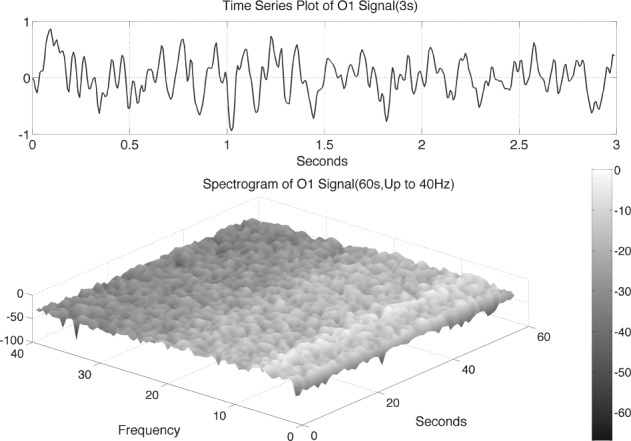
Top panel: illustrative time-series data over 3 sec from the O1 EEG signal of AD patient #1. Bottom panel: the spectrogram over 60 sec of the time-series data up to 40Hz for this patient.

Top panel: illustrative time-series data over 3 sec from the O1 EEG signal of AD patient #1. Bottom panel: the spectrogram over 60 sec of the time-series data up to 40Hz for this patient.