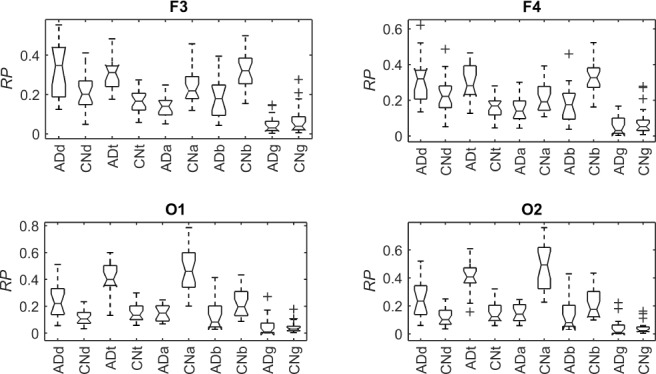
Figure 10.

Boxplots with the distributions of RP in  (“d”),
  (“t”),
  (“a”),
  (“b”), and
  (“g”) bands for AD patients and control subjects (“CN”) at F3, F4, O1, and O2.

Boxplots with the distributions of RP in  (“d”),
  (“t”),
  (“a”),
  (“b”), and
  (“g”) bands for AD patients and control subjects (“CN”) at F3, F4, O1, and O2.