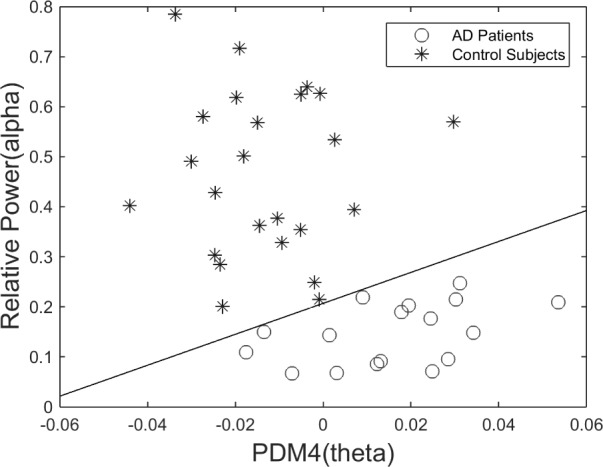
Figure 14.

Scatter-plot of computed ANF linear trends (slopes) for 4th PDMs of the O1-to-F3 system, corresponding to the theta-delta band, versus the Relative Power in O1 corresponding to the alpha band. This classification plot shows no false-negatives and no false-positives.
