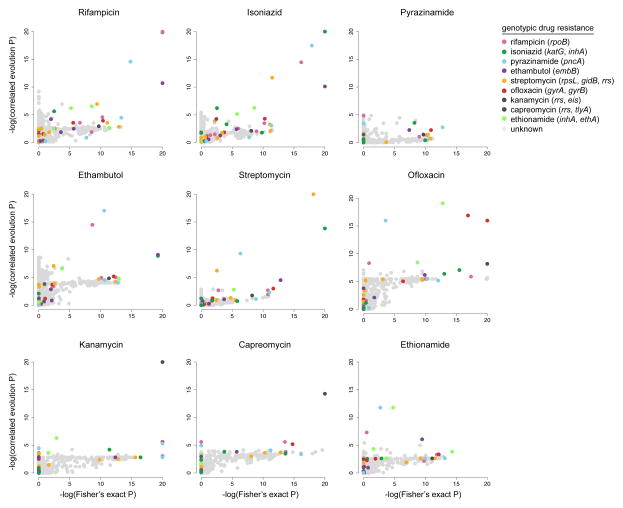
Figure 1.
Significance of associations between genotypic variants and drug resistance phenotypes. Each circle represents a genotypic feature that is plotted at the intersection of the negative log p-values from Fisher’s exact and correlated evolution tests for each drug. P-values were corrected for multiple comparisons using the Benjamini-Hochberg method59. Genotypic variants known to confer resistance are colored according to the drug to which they confer resistance, and genotypes with no known effect on drug resistance are grey. Genotypes scoring well in both tests appear in the upper right quadrants.

