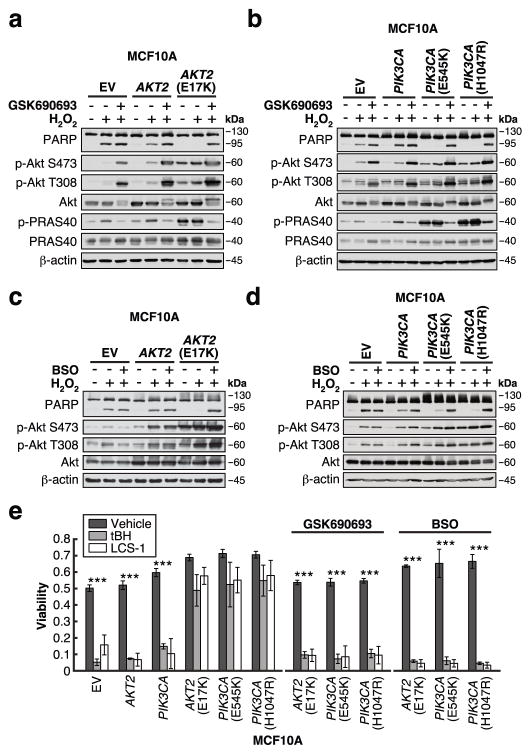
Figure 2. Enhanced GSH biosynthesis confers resistance to oxidative stress.
a–d, Cells were serum-starved for 20–24 h in the presence or absence of (a–b) 1 μM GSK690693 or (c–d) 50 μM BSO, followed by treatment with 500 μM H2O2 for 4 h. Cells were immunoblotted for the indicated proteins (data is representative of three independent experiments). e, Cells were serum-starved for 20–24 h in the presence or absence of 1 μM GSK690693 or 50 μM BSO, followed by treatment with 500 μM tert-butyl hydroperoxide (tBH) or 10 μM LCS-1 for 24 h. Cell viability was measured using a propidium iodide-based plate reader assay (EV, AKT2(E17K): n = 4; AKT2, PIK3CA: n = 3; PIK3CA(E545K), PIK3CA(H1047R): n = 5; n represents number of biologically independent replicates (Supplementary Table 1)). All error bars represent s.e.m. ***P < 0.001 by a two-sided Student’s t-test. Unprocessed original scans of blots are shown in Supplementary Figure 6.

