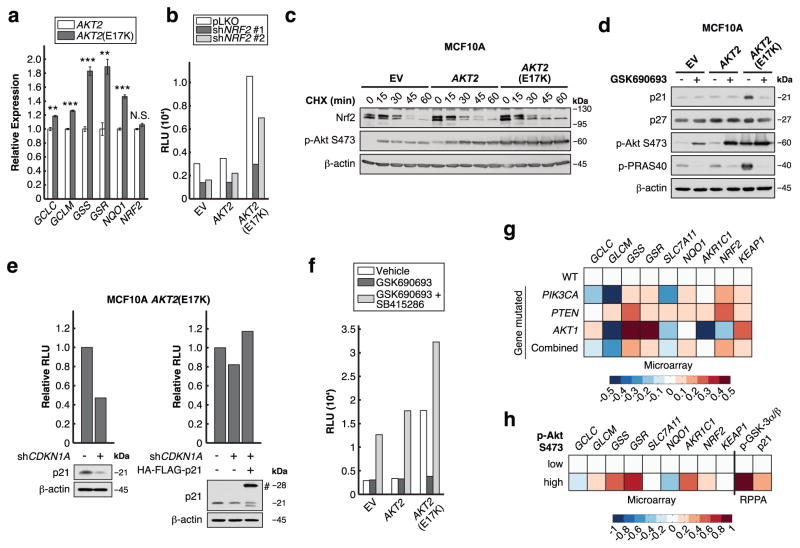
Figure 3. Akt2(E17K) activates Nrf2 to up-regulate the GSH biosynthetic genes.
a, mRNA levels were measured by qRT-PCR and are expressed as fold changes relative to MCF10A AKT2 cells (n = 3 biologically independent replicates (Supplementary Table 1)). b, Nrf2 was knocked down over 72 h, and ARE-luciferase activity was assayed in cells serum-starved for 20-24 h (data are from one experiment that was independently repeated two times with similar results (Supplementary Table 1)). c, Serum-starved cells treated with 20 μg/ml cycloheximide (CHX) were immunoblotted for the indicated proteins (data is representative of three independent experiments). d, Cells serum-starved in the presence or absence of 1 μM GSK690693 for 20–24 h were immunoblotted for the indicated proteins (data is representative of three independent experiments). e, p21 was knocked down in MCF10A AKT2(E17K) cells over 48 h, with or without the expression of shRNA-resistant HA-FLAG-p21 (#). ARE-luciferase activity was assayed in cells serum-starved for 20-24 h (data are from one experiment that was independently repeated five times with similar results (Supplementary Table 1)). f, ARE-luciferase activity was assayed in cells serum-starved for 20–24 h in the presence or absence of 1 μM GSK690693 and 25 μM SB415286 (data are from one experiment that was independently repeated two times with similar results (Supplementary Table 1)). g, h, Patient tumors from TCGA BRCA data set were stratified by (g) PI3K pathway mutation status and (h) Akt pS473 levels (See Supplementary Figure 4d). PIK3CA: PIK3CA mutation, PTEN: PTEN mutation or copy number loss, AKT1: AKT1 mutation, Combined: alterations in PIK3CA or PTEN or AKT1, WT: wild-type PIK3CA, PTEN, and AKT1. The heat map represents microarray/RPPA Z-scores for the indicated genes/proteins, which are expressed relative to values in the WT or Akt pS473 low group. All error bars represent s.e.m. **P < 0.01, ***P < 0.001 by a two-sided Student’s t-test. Unprocessed original scans of blots are shown in Supplementary Figure 6.

