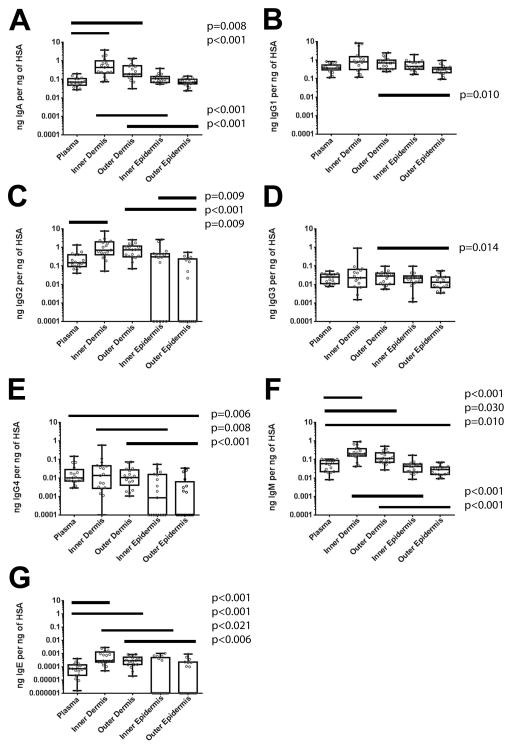
Figure 2. Comparison of dermal and epidermal foreskin Igs to blood Igs.
Foreskin and plasma samples from 17 participants were compared by calculating the ratios of each antibody concentration normalized to Human Serum Albumin (HSA) in each sample. HSA, A) IgA, B) IgG1, C) IgG2, D) IgG3, E) IgG4, F) IgM, and G) IgE were measured by multiplex bead array (MBA). Samples under the level of detection are graphed at the bottom of the axis. Only significant differences in Wilcoxon post-test after Bonferroni correction for eight comparisons are reported in the figure.

