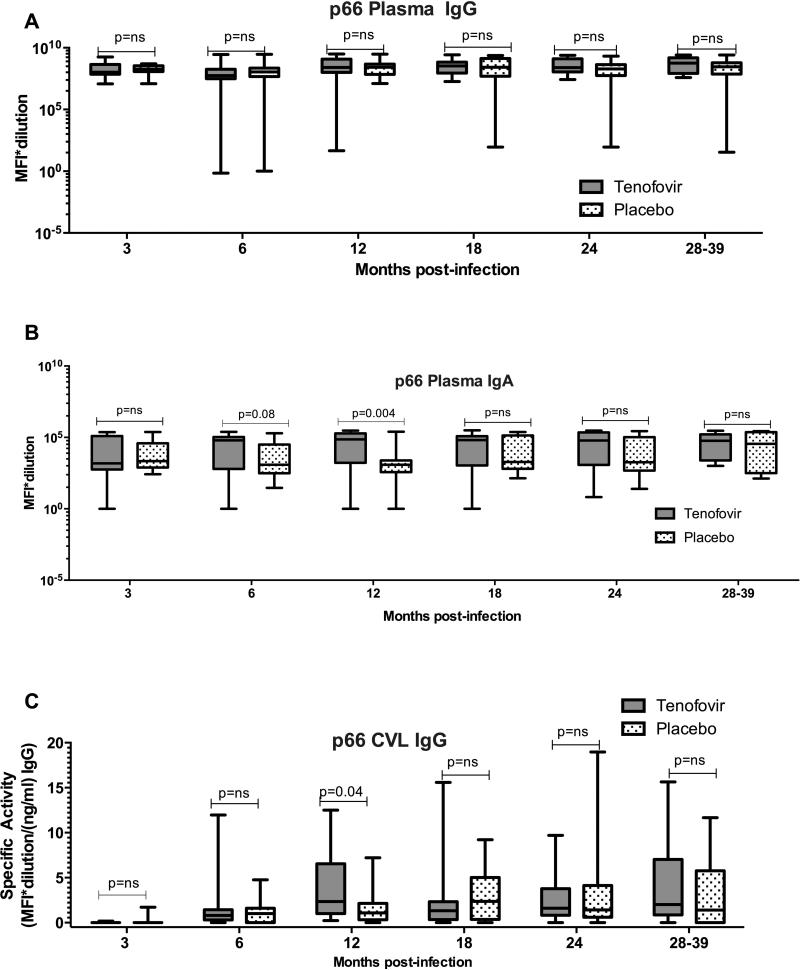
Figure 3. Increased p66 plasma IgA and CVL IgG response magnitude in acute infection with prior tenofovir use.
Plasma response magnitude is presented as MFI*dilution in a (IgG) and b (IgA). CVL response magnitude is presented as specific activity (MFI* dilution factor per ng ml −1) in c (IgG). Boxes denote the 25th and 75th percentile and whiskers denote the minimum and maximum values. The horizontal line represents the median response. Responses with MFI<100 are below the limit of detection for this assay. P<0.05 were statistically significant. Comparisons of MFIs between tenofovir and placebo were done using the Wilcoxon Rank Sums test. CVL, cervicovaginal lavage; MFI, mean fluorescent intensity; NS, not significant.

