
Figure 6.
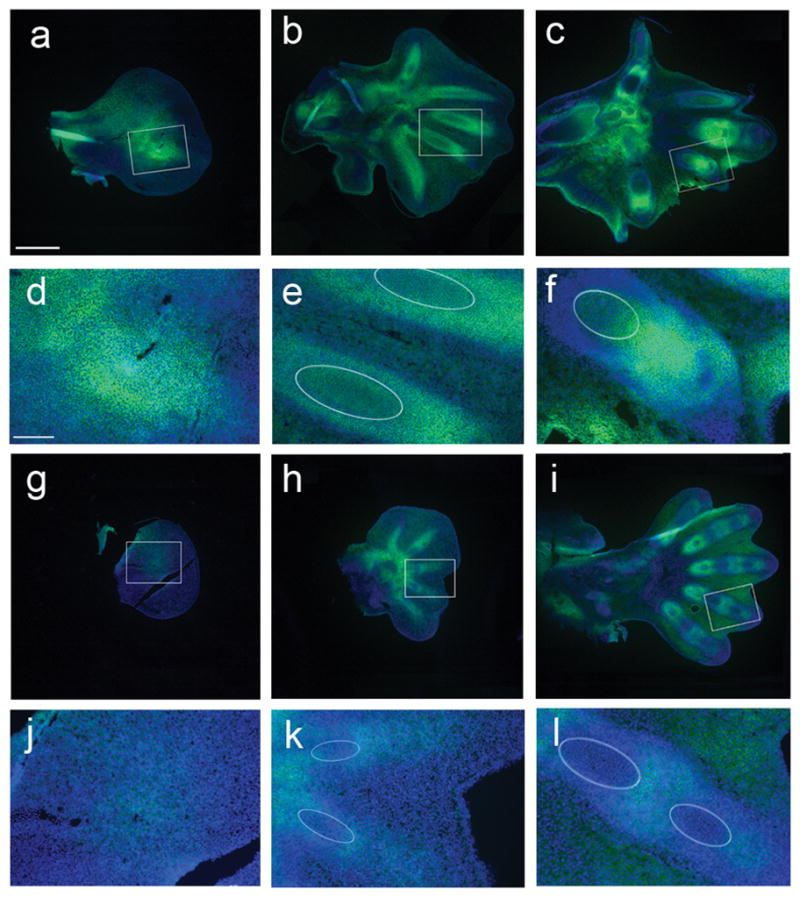
Peanut agglutinin (green) and Hoechst (blue) staining of sagittal sections of bat CS15, CS16 and CS17 forelimb (FL) (a–c) and hindlimb (HL) (g–i) autopods. Higher magnified views of the boxed regions are shown which correspond to the strongest area of PNA staining at CS15 (d and j), digits 3 and 4 at CS16 (e and k) and digit 4 at CS17 (f and l). Ellipses indicate regions of maturing chondrocytes, determined by comparison to H&E staining of adjacent sections (Supplementary Fig. 8). Scale bars of 500 μm (a–c and g–i) and 100 μm (d–f and j–l) are shown.