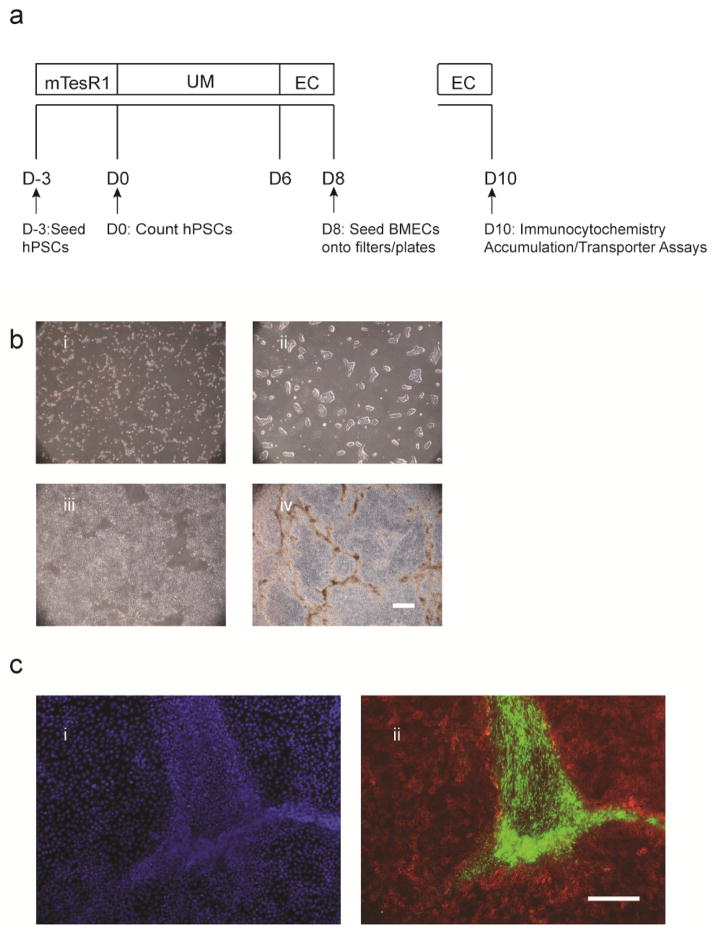
Figure 1.
Differentiation of IMR90-C4 iPSCs to BMECs. a) Timeline for BMEC differentiation and subculture onto plates and filters. b) Bright field images illustrate morphology and density at i) D-2 ii) D0, iii) D2, and iv) D8 of the differentiation. Scale bar equals 500 μm. c) Immunocytochemistry analysis of neural tracts that develop in between endothelial cell clusters at D8 of differentiation. Confluent cell monolayers at D8 of differentiation, shown i) by DAPI nuclear stain, express ii) the endothelial cell marker VE-cadherin (red, Santa Cruz, Clone BV9, Ms IgG2a) in regions surrounding nestin positive neural tracts (green, Millipore, Clone 10C2, Ms IgG1). Scale bar equals 200 μm.

