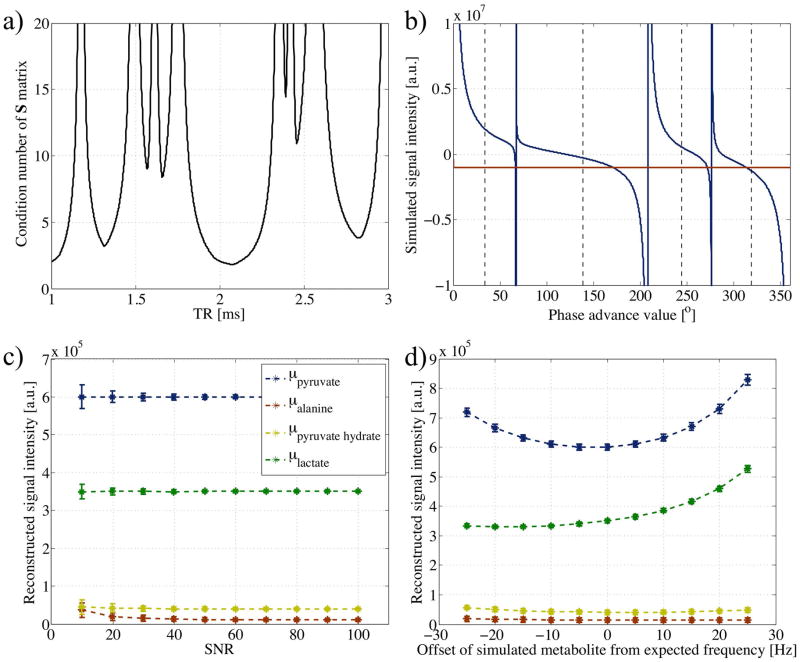
Figure 4.
a) Plot of condition number of matrix S (Equation 4), using chemical shifts for pyruvate, alanine, pyruvate hydrate and lactate of 0, 570.4, 849.9, and 1239.5Hz respectively. For simplicity, phase advance values were fixed midway between SPs. At feasible TR values, a minimum is observed around 2.08ms, the TR selected for in-vivo acquisition. b) Plot of the simulated cumulative signal (real component in blue and imaginary in magenta) as a function of the phase advance value as calculated from Equation 5 using a TR of 2.08ms and chemical shifts as in (a). Dashed vertical lines illustrate points of sampling for reconstruction of separate metabolite contributions. Plots of mean metabolite contributions as calculated by the pseudo-inverse from simulated data samples c) with normally distributed noise added for varying SNR levels, and d) with Δω values adjusted up to ±25Hz from expected (SNR = 30). Error bars reflect the standard deviation over 1000 sample datasets.

